Exhibit 99.1 2022 KLA Investor Day New York City • June 16, 2022 1
Welcome and Opening Remarks Kevin Kessel VP, Investor Relations and Market Analytics
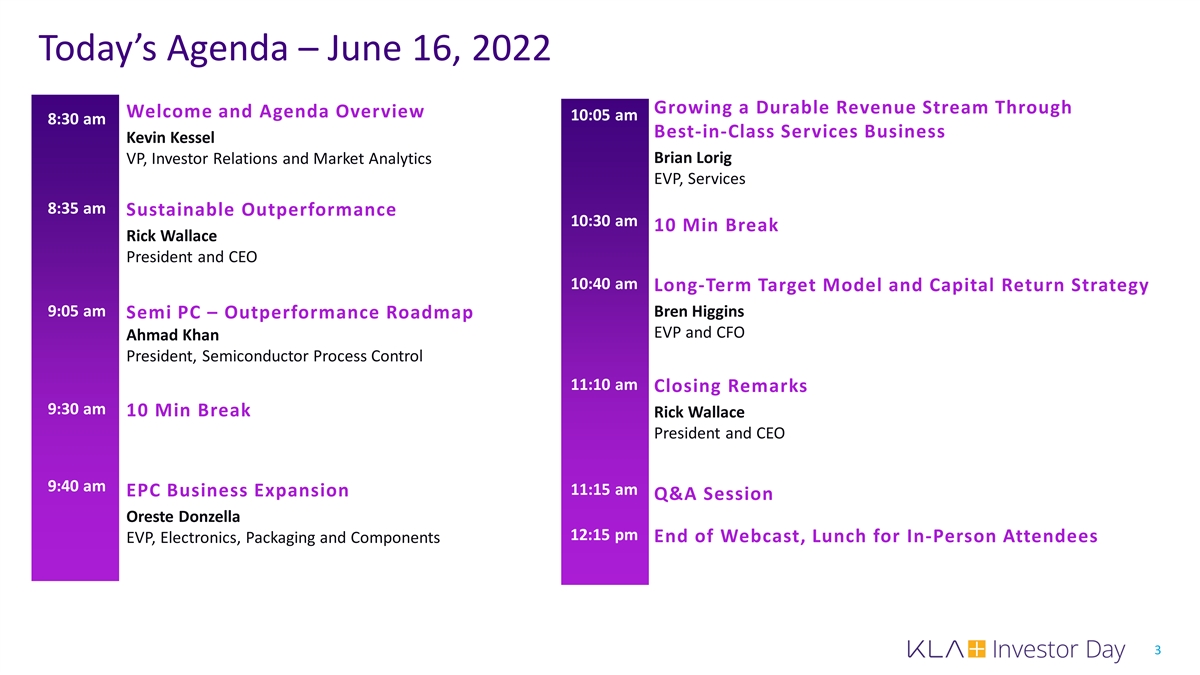
Today’s Agenda – June 16, 2022 Growing a Durable Revenue Stream Through Welcome and Agenda Overview 10:05 am 8:30 am Best-in-Class Services Business Kevin Kessel VP, Investor Relations and Market Analytics Brian Lorig EVP, Services 8:35 am Sustainable Outperformance 10:30 am 10 Min Break Rick Wallace President and CEO 10:40 am Long-Term Target Model and Capital Return Strategy 9:05 am Bren Higgins Semi PC – Outperformance Roadmap EVP and CFO Ahmad Khan President, Semiconductor Process Control 11:10 am Closing Remarks 9:30 am 10 Min Break Rick Wallace President and CEO 9:40 am 11:15 am EPC Business Expansion Q&A Session Oreste Donzella 12:15 pm End of Webcast, Lunch for In-Person Attendees EVP, Electronics, Packaging and Components 3
Disclaimer Statements in this presentation other than historical facts, including but not limited to: (i) future trend of digitization, semiconductor and EPC industry growth and evolution; (ii) geographic breakdowns of future global semiconductor production; (iii) our results of operations and financial conditions for 2022; (iv) our 2026 target model and the underlying assumptions; (v) trajectory of results of operations and financial conditions by 2026; (vi) our plan for future shareholder returns; (vii) our future investment plan; (viii) future opportunities, are forward-looking statements and subject to the Safe Harbor provisions created by the Private Securities Litigation Reform Act of 1995. These forward-looking statements are based on current information and expectations and involve a number of risks and uncertainties. Actual results may differ materially from those projected in such statements due to various factors, including but not limited to: the impact of the COVID-19 pandemic on the global economy and on our business, financial condition and results of operations, including the supply chain constraints we are experiencing as a result of the pandemic; economic, political and social conditions in the countries in which we, our customers and our suppliers operate, including rising inflation and interest rates, Russia's invasion of Ukraine and global trade policies; disruption to our manufacturing facilities or other operations, or the operations of our customers, due to natural catastrophic events, health epidemics or terrorism; ongoing changes in the technology industry, and the semiconductor industry in particular, including future growth rates, pricing trends in end-markets, or changes in customer capital spending patterns; our ability to timely develop new technologies and products that successfully anticipate or address changes in the semiconductor industry; our ability to maintain our technology advantage and protect our proprietary rights; our ability to compete with new products introduced by our competitors; our ability to attract and retain key personnel; cybersecurity threats, cyber incidents affecting our and our service providers' systems and networks and our ability to access critical information systems for daily business operations; liability to our customers under indemnification provisions if our products fail to operate properly or contain defects or our customers are sued by third parties due to our products; exposure to a highly concentrated customer base; availability and cost of the wide range of materials used in the production of our products; our ability to operate our business in accordance with our business plan; legal, regulatory and tax environments in which we perform our operations and conduct our business and our ability to comply with relevant laws and regulations; our ability to pay interest and repay the principal of our current indebtedness is dependent upon our ability to manage our business operations, our credit rating and the ongoing interest rate environment, among other factors; instability in the global credit and financial markets; our exposure to currency exchange rate fluctuations, or declining economic conditions in those countries where we conduct our business; changes in our effective tax rate resulting from changes in the tax rates imposed by jurisdictions where our profits are determined to be earned and taxed, expiration of tax holidays in certain jurisdictions, resolution of issues arising from tax audits with various authorities or changes in tax laws or the interpretation of such tax laws; and our ability to identify suitable acquisition targets and successfully integrate and manage acquired businesses. For other factors that may cause actual results to differ materially from those projected and anticipated in forward-looking statements in this press release, please refer to KLA Corporation's Annual Report on Form 10-K for the year ended June 30, 2021, and other subsequent filings with the Securities and Exchange Commission. KLA Corporation assumes no obligation to, and does not currently intend to, update these forward-looking statements. In addition, historical, current, and forward-looking ESG-related statements may be based on standards for measuring progress that are still developing, and internal controls and processes that continue to evolve. Forward-looking and other statements may also address our corporate responsibility and sustainability progress, plans, and goals, and the inclusion of such statements is not an indication that these contents are necessarily material for the purposes of complying with or reporting pursuant to the U.S. federal securities laws and regulations, even if we use the word “material” or “materiality.” This presentation also includes non-GAAP measures that our management consider are helpful to investors in understanding our current and future business. For reconciliation of non-GAAP measures to the most directly comparable GAAP measures, please see Appendix at the end of the presentation. The non-GAAP information is among the budgeting and planning tools that management uses for future forecasting. However, because there are no standardized or generally accepted definitions for most non-GAAP financial metrics, definitions of non-GAAP financial metrics are inherently subject to significant discretion (for example, determining which costs and expenses to exclude when calculating such a metric). As a result, non-GAAP financial metrics may be defined very differently from company to company, or even from period to period within the same company, which can potentially limit the usefulness of such information to an investor. The presentation of non-GAAP and supplemental information is not meant to be considered in isolation or as a substitute for results prepared and presented in accordance with United States GAAP. With respect to third-party data, we do not independently verify or audit, or commit to independently verifying or auditing, their information. 4
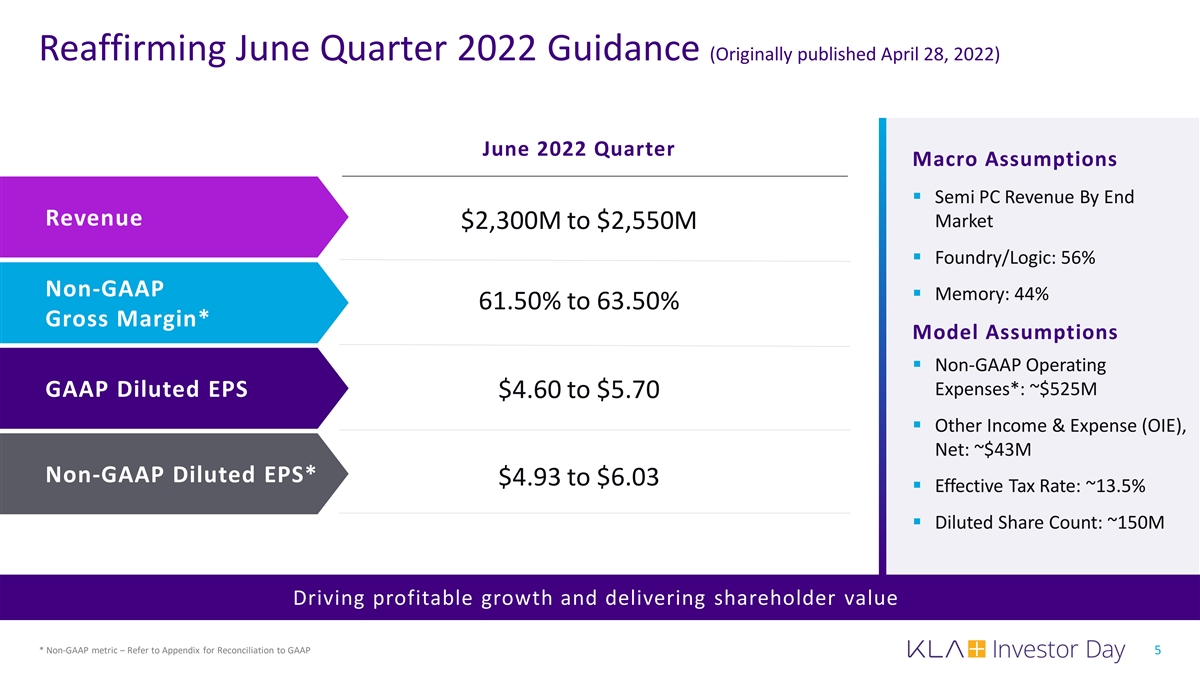
Reaffirming June Quarter 2022 Guidance (Originally published April 28, 2022) June 2022 Quarter Macro Assumptions § Semi PC Revenue By End Revenue Market $2,300M to $2,550M § Foundry/Logic: 56% Non-GAAP § Memory: 44% 61.50% to 63.50% Gross Margin* Model Assumptions § Non-GAAP Operating Expenses*: ~$525M GAAP Diluted EPS $4.60 to $5.70 § Other Income & Expense (OIE), Net: ~$43M Non-GAAP Diluted EPS* $4.93 to $6.03 § Effective Tax Rate: ~13.5% § Diluted Share Count: ~150M Driving profitable growth and delivering shareholder value * Non-GAAP metric – Refer to Appendix for Reconciliation to GAAP 5
Sustainable Outperformance Rick Wallace President and CEO
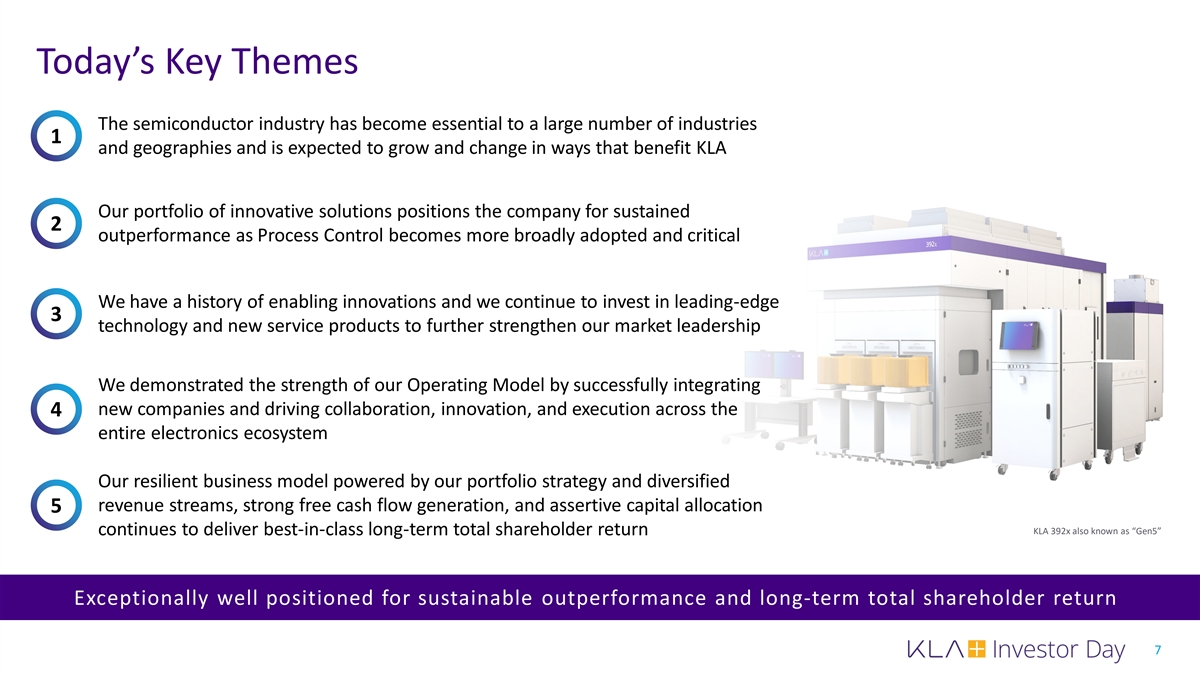
Today’s Key Themes The semiconductor industry has become essential to a large number of industries 1 and geographies and is expected to grow and change in ways that benefit KLA Our portfolio of innovative solutions positions the company for sustained 2 outperformance as Process Control becomes more broadly adopted and critical We have a history of enabling innovations and we continue to invest in leading-edge 3 technology and new service products to further strengthen our market leadership We demonstrated the strength of our Operating Model by successfully integrating new companies and driving collaboration, innovation, and execution across the 4 entire electronics ecosystem Our resilient business model powered by our portfolio strategy and diversified revenue streams, strong free cash flow generation, and assertive capital allocation 5 KLA 392x also known as “Gen5” continues to deliver best-in-class long-term total shareholder return Exceptionally well positioned for sustainable outperformance and long-term total shareholder return 7
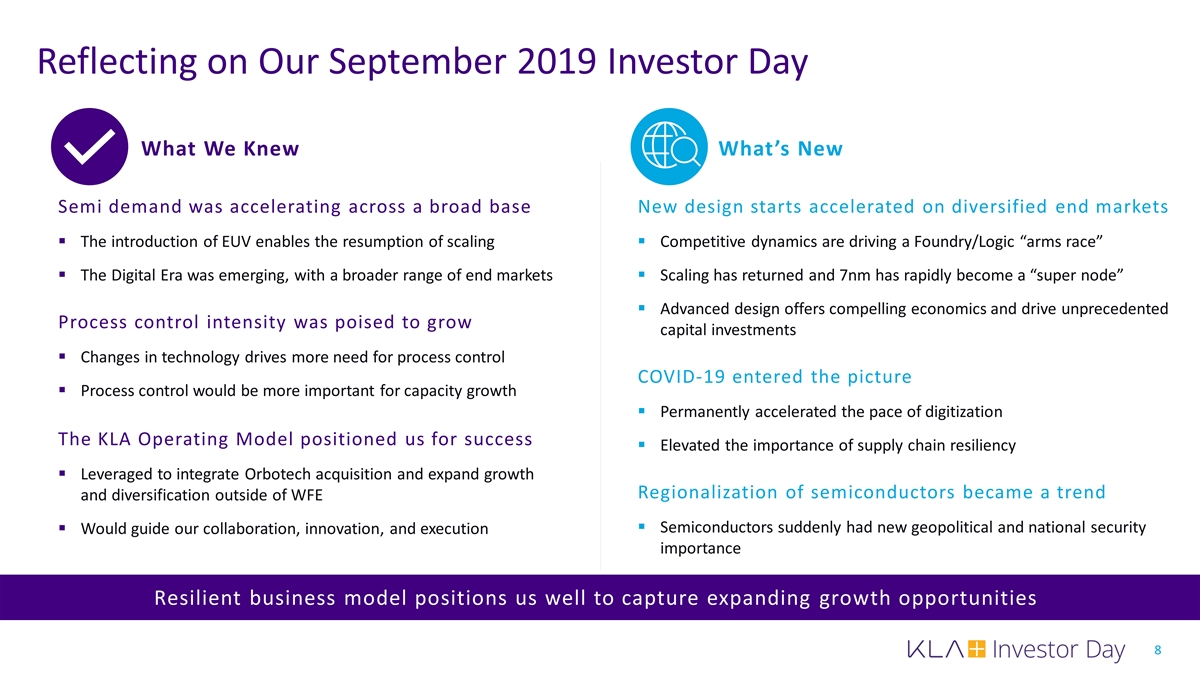
Reflecting on Our September 2019 Investor Day § Resilient business model positions us well to capture expanding growth opportunities What We Knew What’s New Semi demand was accelerating across a broad base New design starts accelerated on diversified end markets § The introduction of EUV enables the resumption of scaling§ Competitive dynamics are driving a Foundry/Logic “arms race” § The Digital Era was emerging, with a broader range of end markets§ Scaling has returned and 7nm has rapidly become a “super node” § Advanced design offers compelling economics and drive unprecedented Process control intensity was poised to grow capital investments § Changes in technology drives more need for process control COVID-19 entered the picture § Process control would be more important for capacity growth § Permanently accelerated the pace of digitization The KLA Operating Model positioned us for success § Elevated the importance of supply chain resiliency § Leveraged to integrate Orbotech acquisition and expand growth Regionalization of semiconductors became a trend and diversification outside of WFE § Semiconductors suddenly had new geopolitical and national security § Would guide our collaboration, innovation, and execution importance Resilient business model positions us well to capture expanding growth opportunities 8
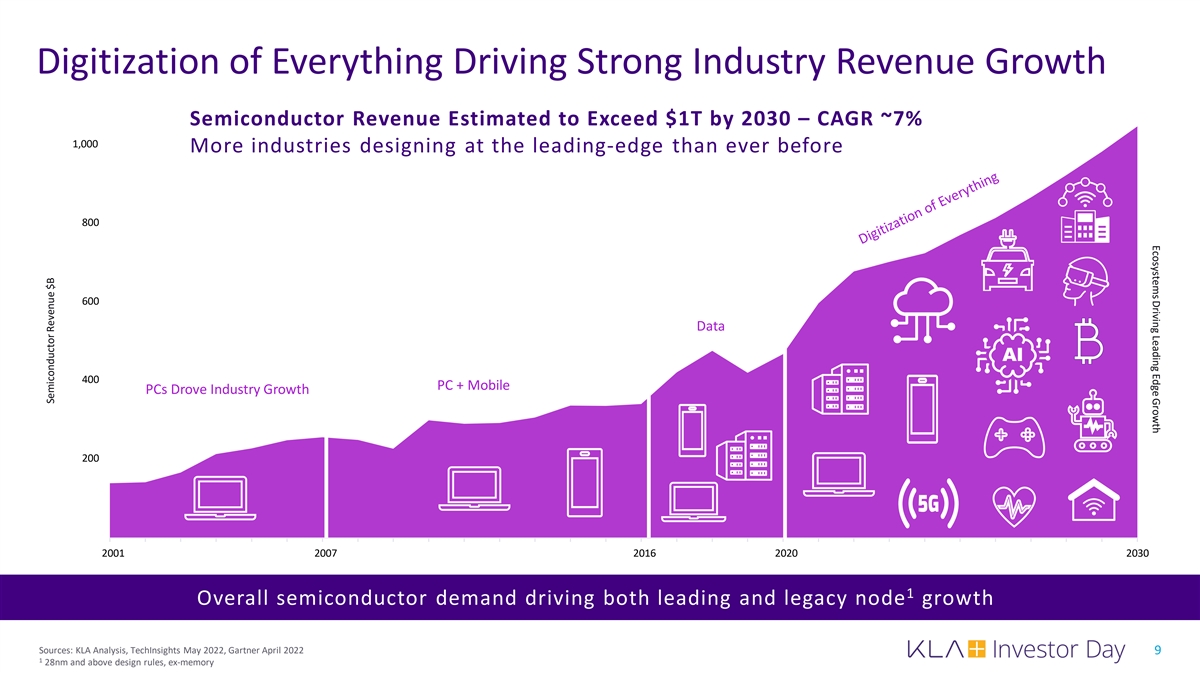
Ecosystems Driving Leading Edge Growth Digitization of Everything Driving Strong Industry Revenue Growth Semiconductor Revenue Estimated to Exceed $1T by 2030 – CAGR ~7% 1,000 More industries designing at the leading-edge than ever before 800 600 Data 400 PC + Mobile PCs Drove Industry Growth 200 2001 2007 2016 2020 2030 1 Overall semiconductor demand driving both leading and legacy node growth Sources: KLA Analysis, TechInsights May 2022, Gartner April 2022 9 1 28nm and above design rules, ex-memory Semiconductor Revenue $B
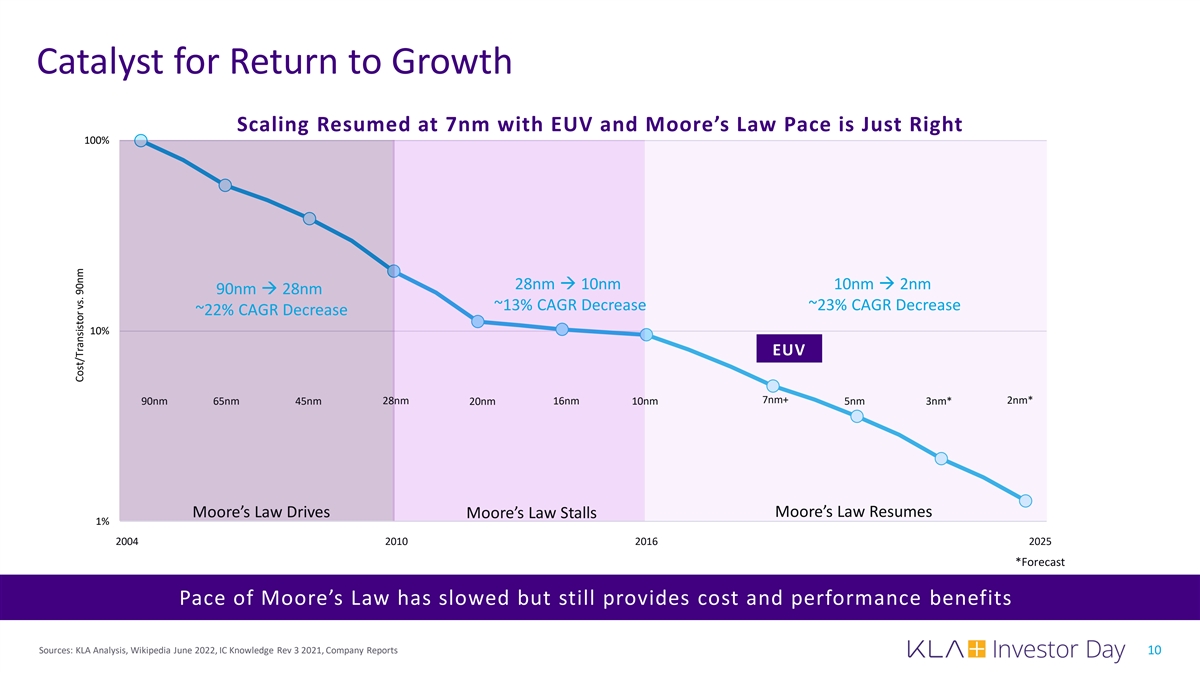
Catalyst for Return to Growth Scaling Resumed at 7nm with EUV and Moore’s Law Pace is Just Right 100% 28nm à 10nm 10nm à 2nm 90nm à 28nm ~13% CAGR Decrease ~23% CAGR Decrease ~22% CAGR Decrease 10% EUV 7nm+ 2nm* 90nm 65nm 45nm 28nm 20nm 16nm 10nm 5nm 3nm* Moore’s Law Drives Moore’s Law Resumes Moore’s Law Stalls 1% 2004 2010 2016 2025 *Forecast Pace of Moore’s Law has slowed but still provides cost and performance benefits Sources: KLA Analysis, Wikipedia June 2022, IC Knowledge Rev 3 2021, Company Reports 10 Cost/Transistor vs. 90nm
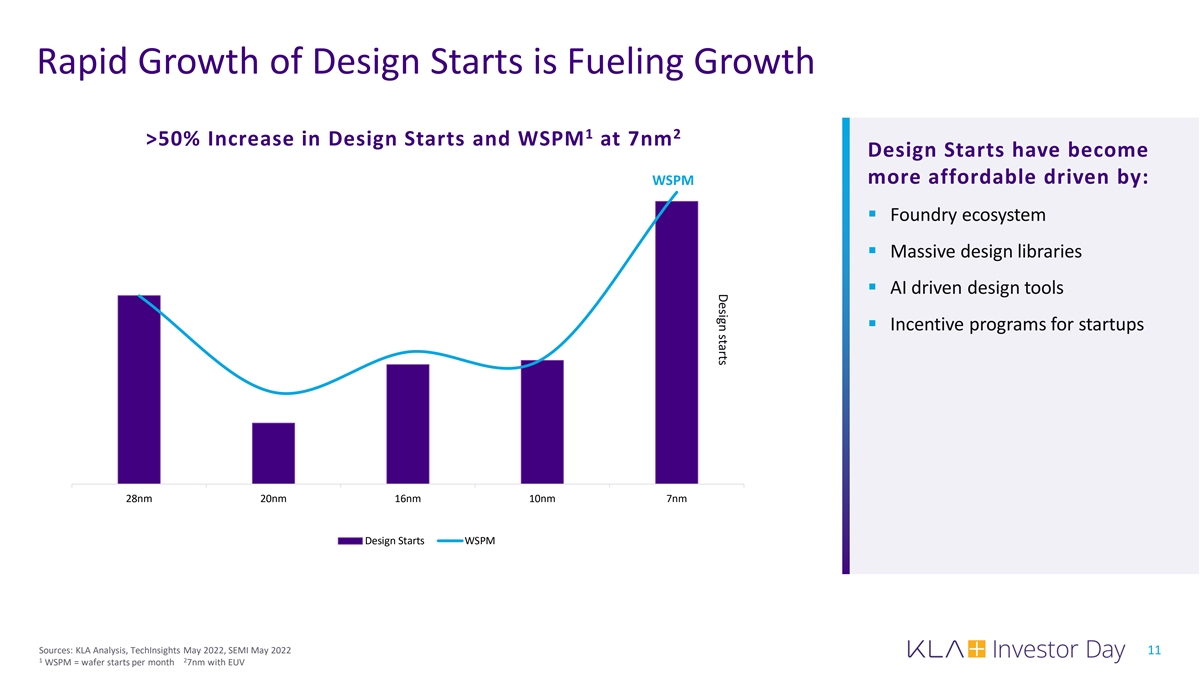
Design starts Rapid Growth of Design Starts is Fueling Growth 1 2 >50% Increase in Design Starts and WSPM at 7nm Design Starts have become more affordable driven by: WSPM § Foundry ecosystem § Massive design libraries § AI driven design tools § Incentive programs for startups 28nm 20nm 16nm 10nm 7nm Design Starts WSPM Sources: KLA Analysis, TechInsights May 2022, SEMI May 2022 11 1 2 WSPM = wafer starts per month 7nm with EUV

Supply Chain Regionalization is Driving Significant Investments Asia: China th 14 5-Year Plan Korea K-Belt Percentage of Initiative Semi Production* Japan, Singapore EU Digital & Malaysia Compass & Govt. Subsidies Country Investments U.S. Fabs 50% 4 53% Act and 70% 48 80% CHIPS Act 10 20% 19% 13% 8% 30% 28% 17% 12% 2001 2011 2021 2031 U. S. Europe Asia §§§ *Sources: KLA Analysis, Gartner, Chips Act Updated plans Brand new plans New Fab Projects since 2019 since 2019 Tracking >60 major fab projects announced or broken ground since last investor day Sources: KLA Analysis, SEMI May 2022, Company Announcements 12 1 Fab Projects = New Fabs + Major Fab Expansions
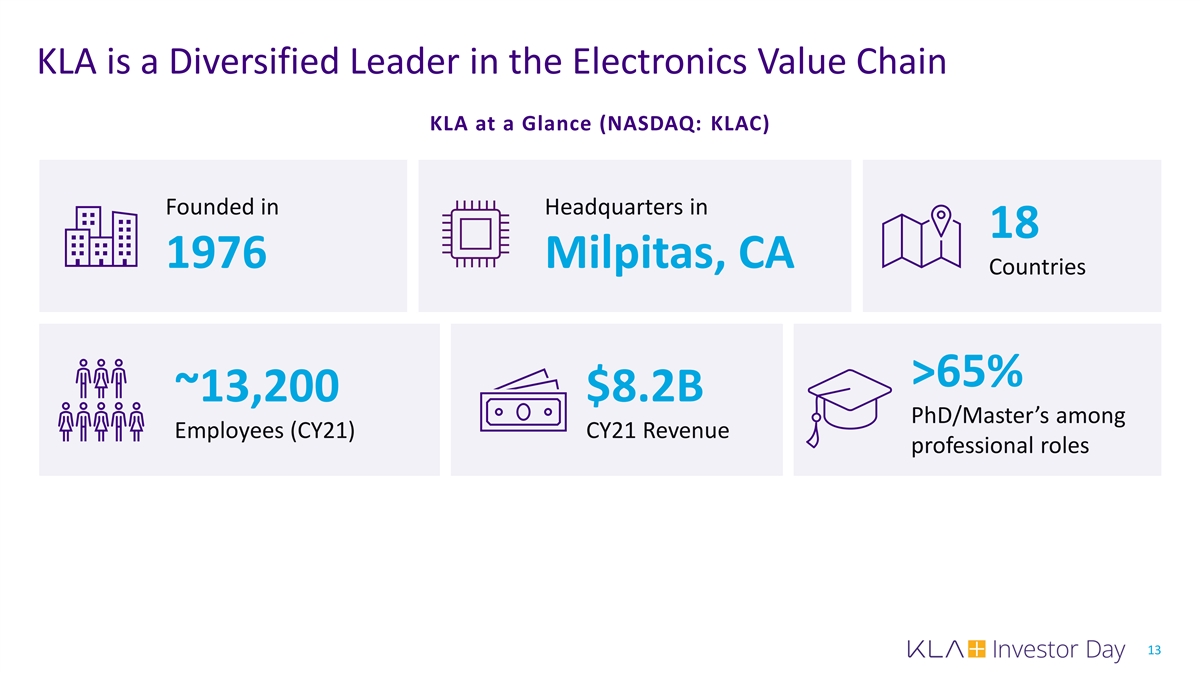
KLA is a Diversified Leader in the Electronics Value Chain KLA at a Glance (NASDAQ: KLAC) Founded in Headquarters in 18 1976 Milpitas, CA Countries >65% ~13,200 $8.2B PhD/Master’s among Employees (CY21) CY21 Revenue professional roles 13
Proven Leadership Team Utilizing the KLA Operating Model to Drive Collaboration, Innovation, and Execution Rick Wallace Bren Higgins Ahmad Khan Oreste Donzella Brian Lorig CEO & EVP, CFO & President, Semiconductor EVP, Electronics, Packaging EVP, President Global Operations Process Control and Components Global Services Joined: 1988 1999 2004 1999 1998 Ben Tsai Bobby Bell John Van Camp MaryBeth Wilkinson EVP, CTO & EVP, EVP, Chief Human EVP, Chief Legal Officer & Corporate Alliances Chief Strategy Officer Resources Officer Corporate Secretary 1984 1994 2006 2020 14
ESG at KLA Environmental § Began annual reporting of global climate emissions in 2021 § 100% renewable electricity commitment by 2030 § $1.5B sustainability-linked revolving credit facility Social § First inclusion and diversity (I&D) disclosure in 2020 § Driving cultural change to benefit from I&D § KLA Foundation invests in all of our communities Governance § Broad & diverse independent board of directors § Active, well-funded internal audit function § Management compensation aligned with shareholder interests Commitment to continuous innovation 15
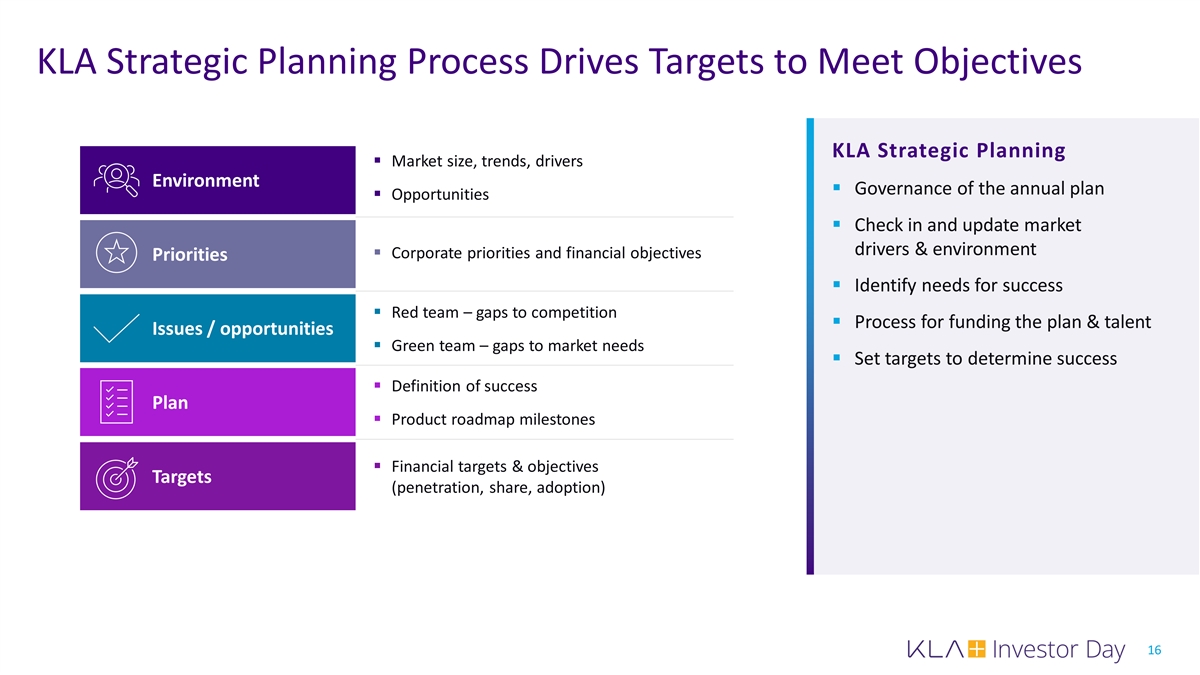
KLA Strategic Planning Process Drives Targets to Meet Objectives KLA Strategic Planning § Market size, trends, drivers Environment § Governance of the annual plan § Opportunities § Check in and update market drivers & environment § Corporate priorities and financial objectives Priorities § Identify needs for success § Red team – gaps to competition § Process for funding the plan & talent Issues / opportunities § Green team – gaps to market needs § Set targets to determine success § Definition of success Plan § Product roadmap milestones § Financial targets & objectives Targets (penetration, share, adoption) 16
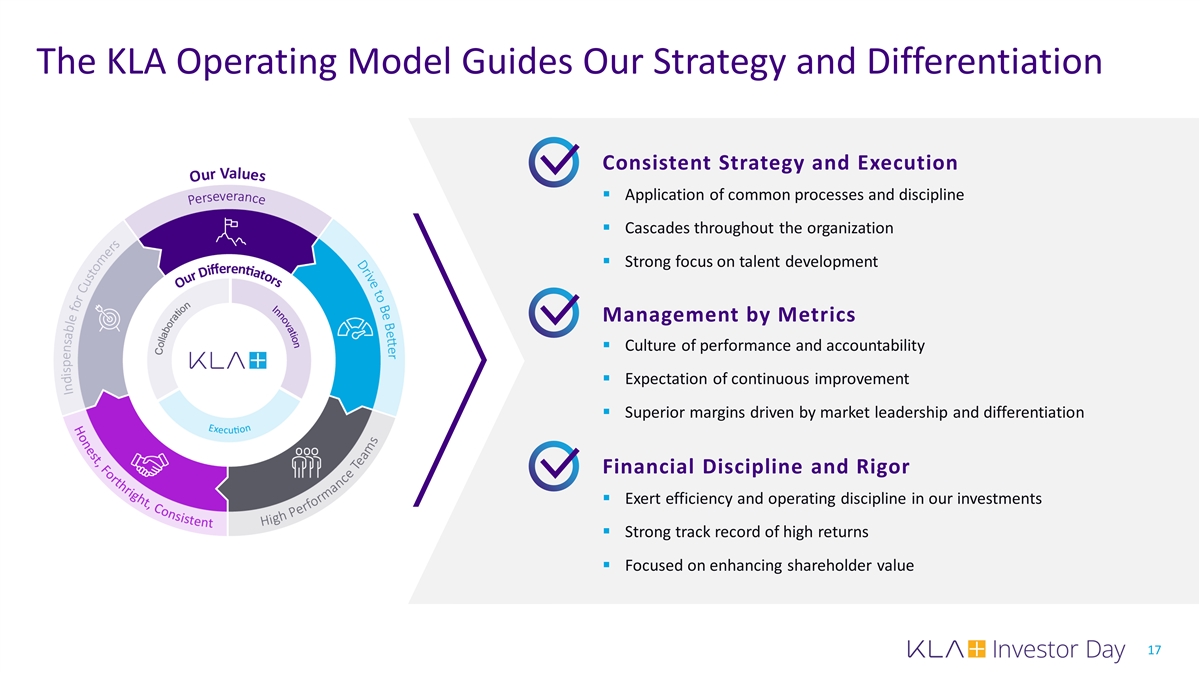
The KLA Operating Model Guides Our Strategy and Differentiation Consistent Strategy and Execution § Application of common processes and discipline § Cascades throughout the organization § Strong focus on talent development Management by Metrics § Culture of performance and accountability § Expectation of continuous improvement § Superior margins driven by market leadership and differentiation Financial Discipline and Rigor § Exert efficiency and operating discipline in our investments § Strong track record of high returns § Focused on enhancing shareholder value 17
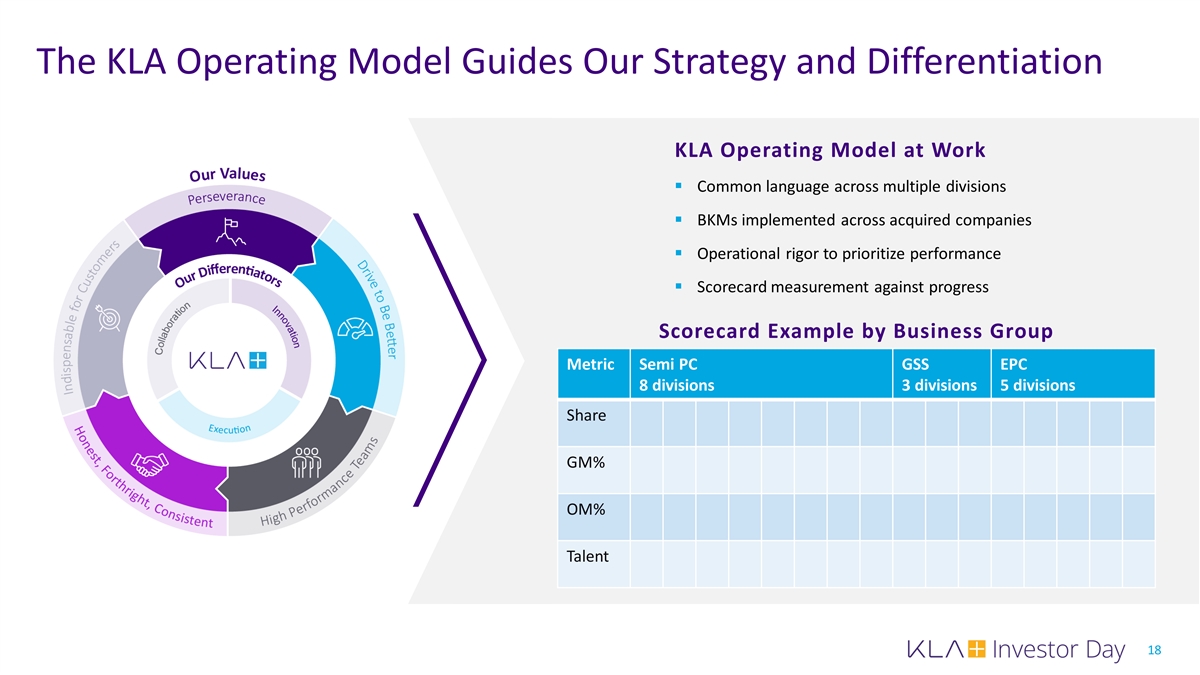
The KLA Operating Model Guides Our Strategy and Differentiation KLA Operating Model at Work § Common language across multiple divisions § BKMs implemented across acquired companies § Operational rigor to prioritize performance § Scorecard measurement against progress Scorecard Example by Business Group Metric Semi PC GSS EPC 8 divisions 3 divisions 5 divisions Share GM% OM% Talent 18
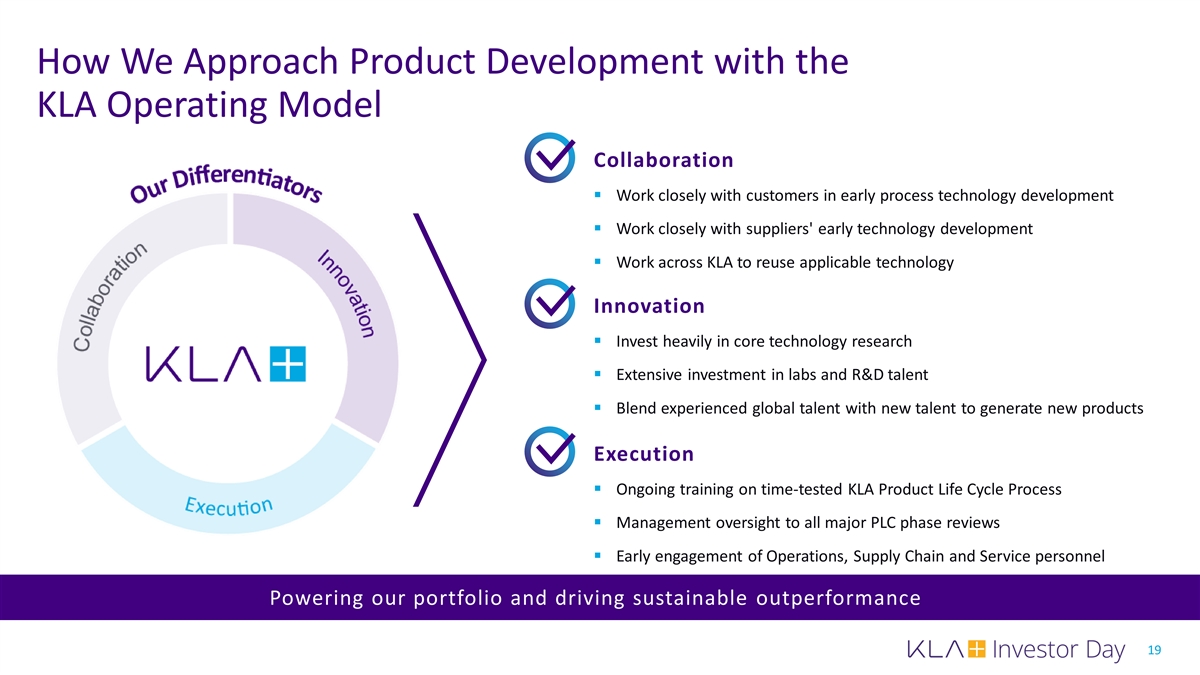
How We Approach Product Development with the KLA Operating Model Collaboration § Work closely with customers in early process technology development § Work closely with suppliers' early technology development § Work across KLA to reuse applicable technology Innovation § Invest heavily in core technology research § Extensive investment in labs and R&D talent § Blend experienced global talent with new talent to generate new products Execution § Ongoing training on time-tested KLA Product Life Cycle Process § Management oversight to all major PLC phase reviews § Early engagement of Operations, Supply Chain and Service personnel Powering our portfolio and driving sustainable outperformance 19
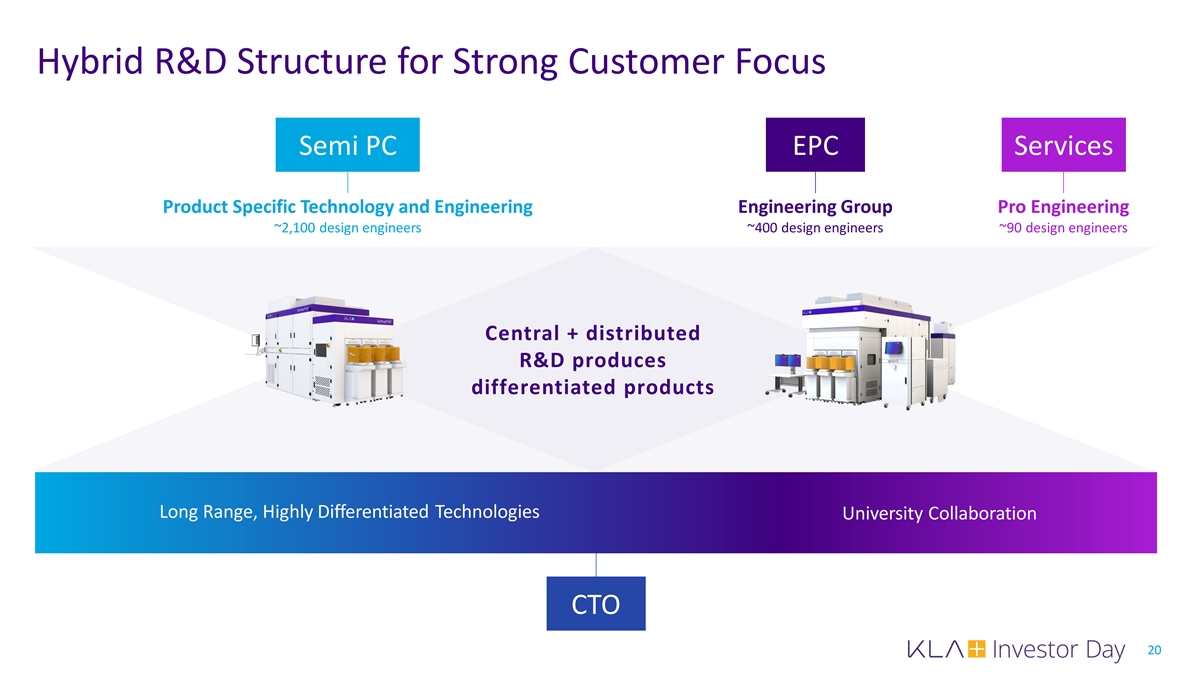
Hybrid R&D Structure for Strong Customer Focus Semi PC EPC Services Product Specific Technology and Engineering Engineering Group Pro Engineering ~2,100 design engineers ~400 design engineers ~90 design engineers Central + distributed R&D produces differentiated products Long Range, Highly Differentiated Technologies University Collaboration CTO 20
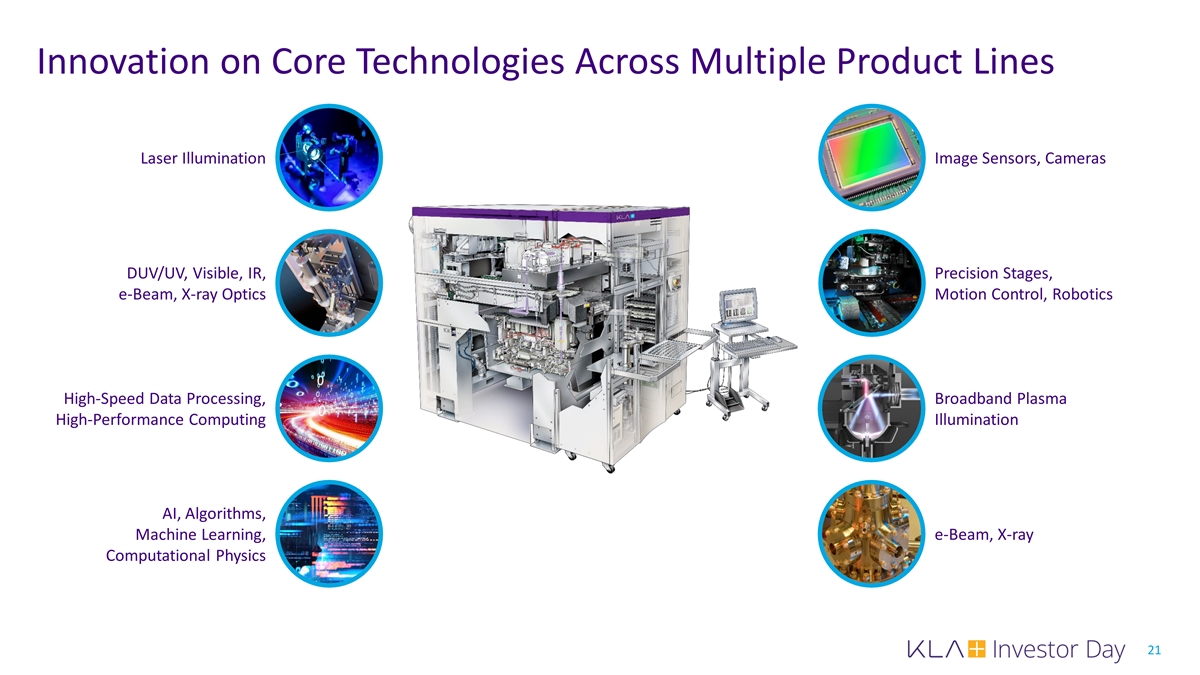
Innovation on Core Technologies Across Multiple Product Lines Laser Illumination Image Sensors, Cameras DUV/UV, Visible, IR, Precision Stages, e-Beam, X-ray Optics Motion Control, Robotics High-Speed Data Processing, Broadband Plasma High-Performance Computing Illumination AI, Algorithms, Machine Learning, e-Beam, X-ray Computational Physics 21
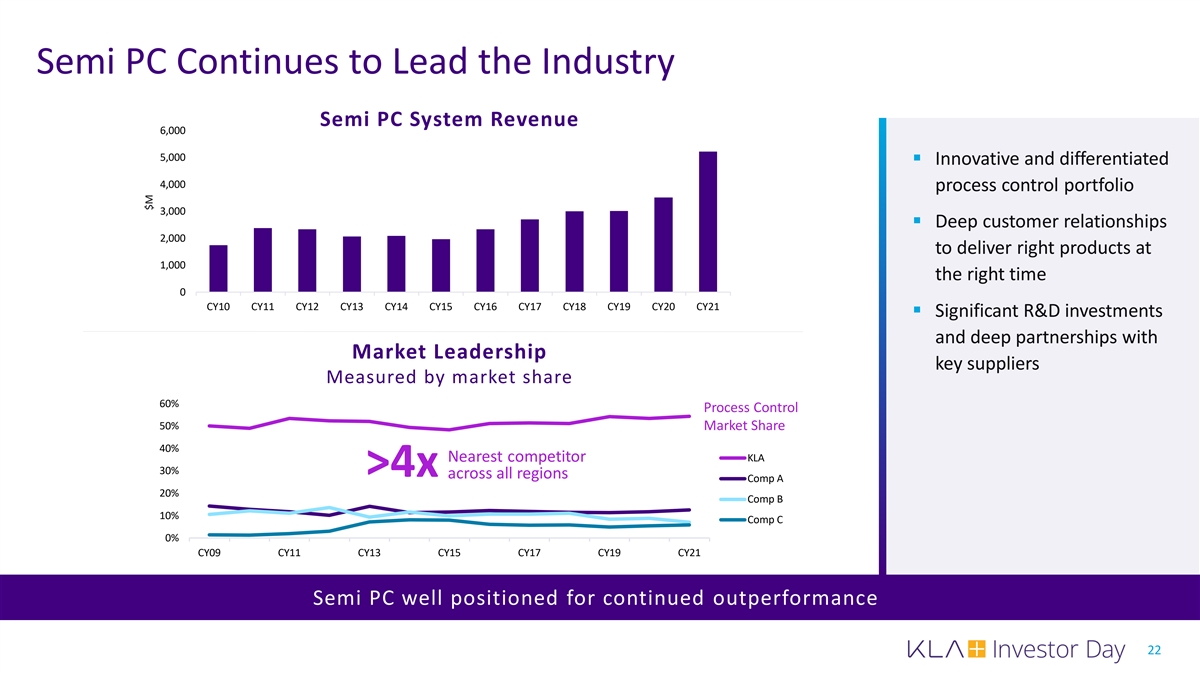
Semi PC Continues to Lead the Industry Semi PC System Revenue 6,000 5,000 § Innovative and differentiated 4,000 process control portfolio 3,000 § Deep customer relationships 2,000 to deliver right products at 1,000 the right time 0 CY10 CY11 CY12 CY13 CY14 CY15 CY16 CY17 CY18 CY19 CY20 CY21 § Significant R&D investments and deep partnerships with Market Leadership key suppliers Measured by market share 60% Process Control 50% Market Share 40% KLA Nearest competitor 30% >4x across all regions Comp A 20% Comp B 10% Comp C 0% CY09 CY11 CY13 CY15 CY17 CY19 CY21 Semi PC well positioned for continued outperformance 22 $M
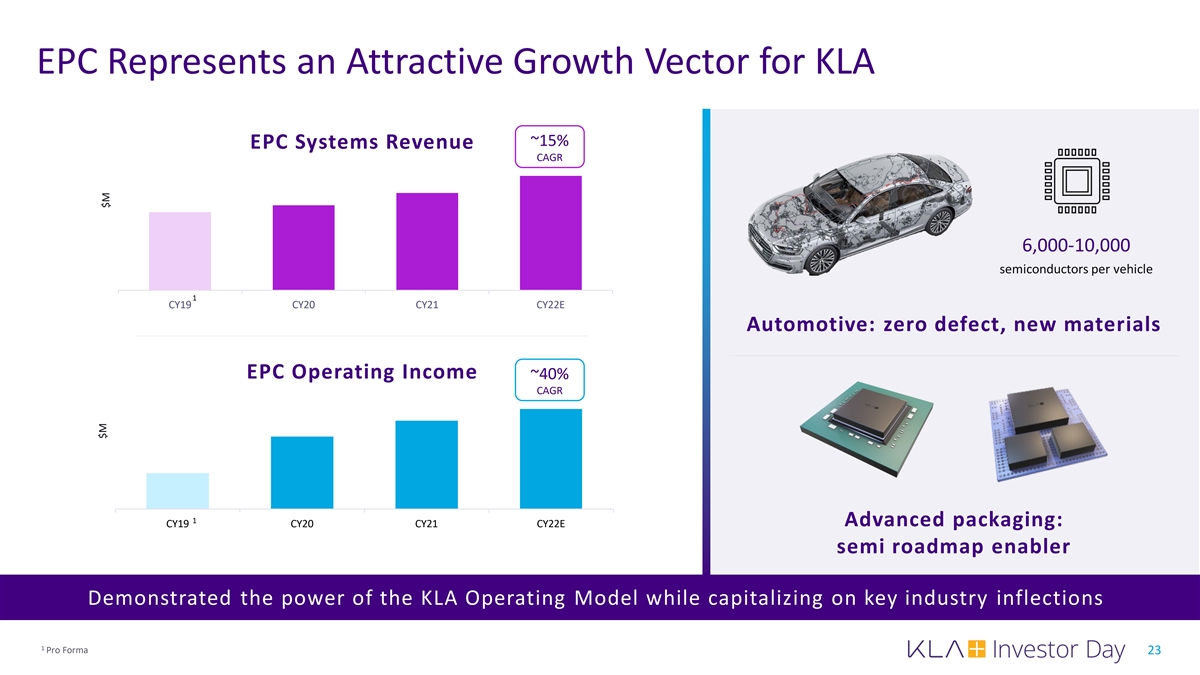
EPC Represents an Attractive Growth Vector for KLA ~15% EPC Systems Revenue CAGR 6,000-10,000 semiconductors per vehicle 1 CY19 CY20 CY21 CY22E Automotive: zero defect, new materials EPC Operating Income ~40% CAGR 1 Advanced packaging: CY19 CY20 CY21 CY22E semi roadmap enabler Demonstrated the power of the KLA Operating Model while capitalizing on key industry inflections 1 Pro Forma 23 $M $M
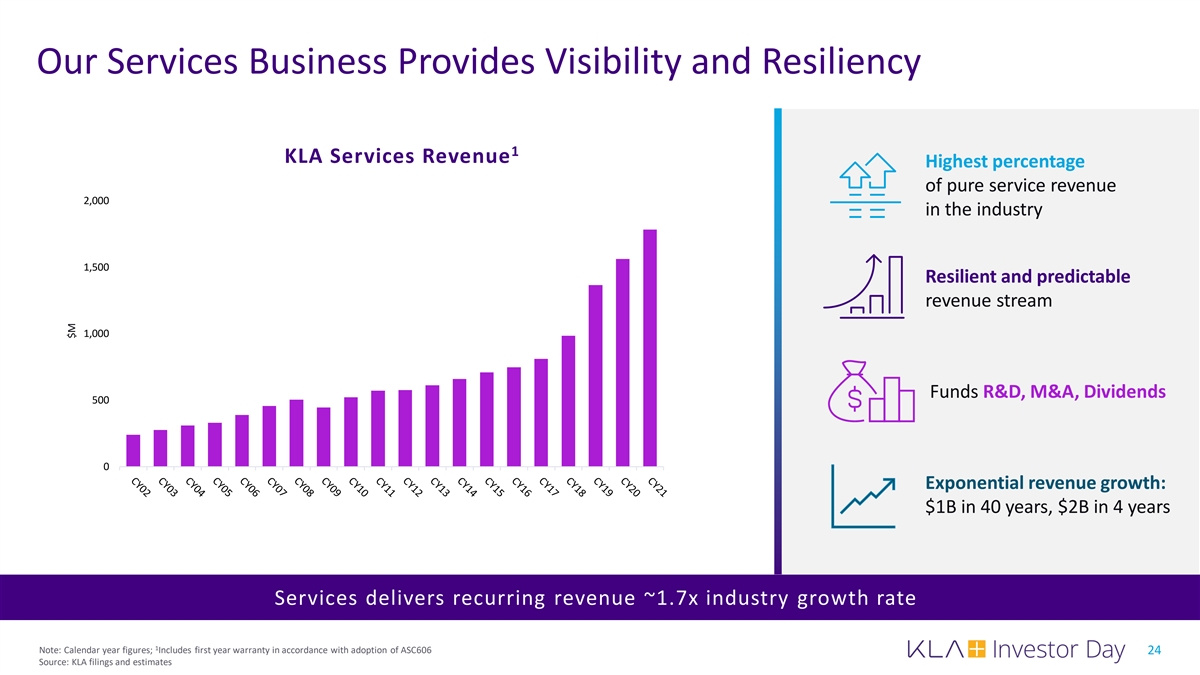
Our Services Business Provides Visibility and Resiliency 1 KLA Services Revenue Highest percentage of pure service revenue 2,000 in the industry 1,500 Resilient and predictable revenue stream 1,000 Funds R&D, M&A, Dividends 500 0 Exponential revenue growth: $1B in 40 years, $2B in 4 years Services delivers recurring revenue ~1.7x industry growth rate 1 Note: Calendar year figures; Includes first year warranty in accordance with adoption of ASC606 24 Source: KLA filings and estimates $M
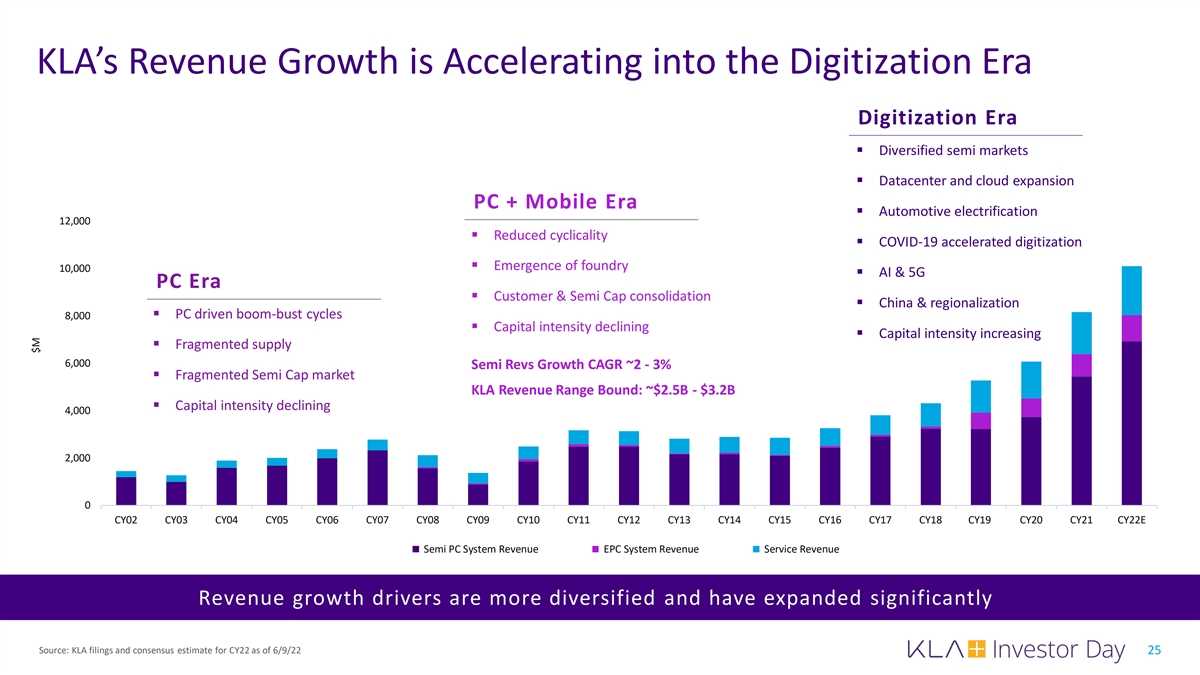
KLA’s Revenue Growth is Accelerating into the Digitization Era Digitization Era § Diversified semi markets § Datacenter and cloud expansion PC + Mobile Era § Automotive electrification 12,000 § Reduced cyclicality § COVID-19 accelerated digitization § Emergence of foundry 10,000 § AI & 5G PC Era § Customer & Semi Cap consolidation § China & regionalization § PC driven boom-bust cycles 8,000 § Capital intensity declining § Capital intensity increasing § Fragmented supply 6,000 Semi Revs Growth CAGR ~2 - 3% § Fragmented Semi Cap market KLA Revenue Range Bound: ~$2.5B - $3.2B § Capital intensity declining 4,000 2,000 0 CY02 CY03 CY04 CY05 CY06 CY07 CY08 CY09 CY10 CY11 CY12 CY13 CY14 CY15 CY16 CY17 CY18 CY19 CY20 CY21 CY22E Semi PC System Revenue EPC System Revenue Service Revenue Revenue growth drivers are more diversified and have expanded significantly Source: KLA filings and consensus estimate for CY22 as of 6/9/22 25 $M
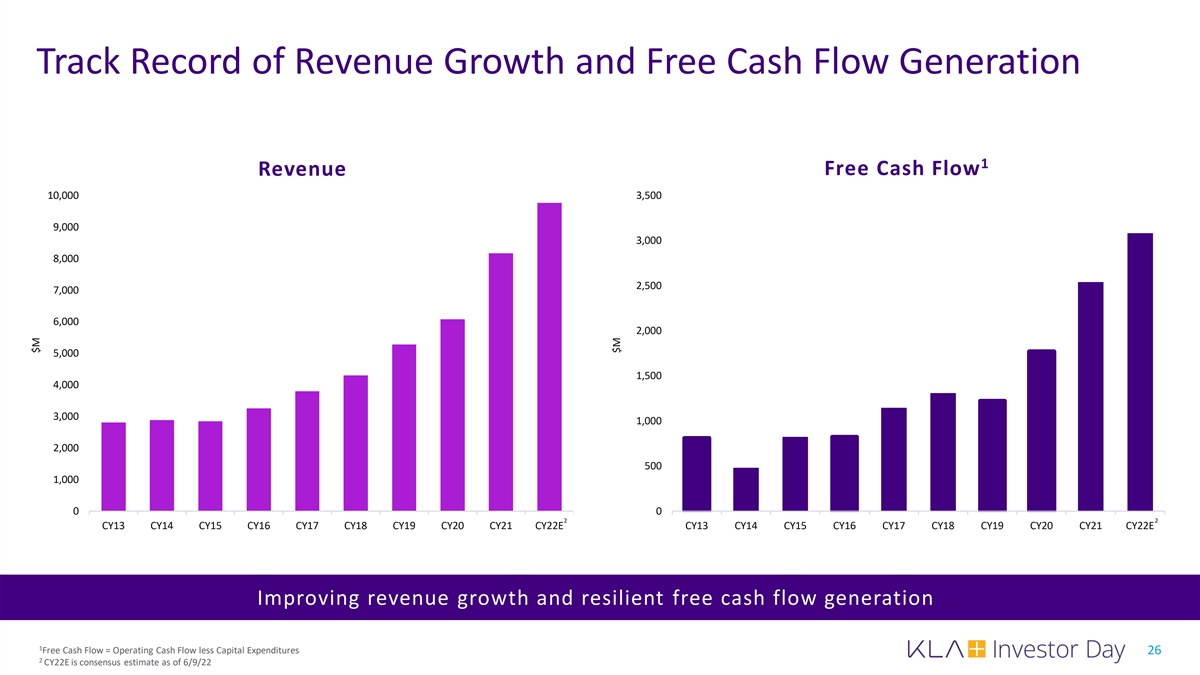
Track Record of Revenue Growth and Free Cash Flow Generation 1 Free Cash Flow Revenue 10,000 3,500 9,000 3,000 8,000 2,500 7,000 6,000 2,000 5,000 1,500 4,000 3,000 1,000 2,000 500 1,000 0 0 2 2 CY13 CY14 CY15 CY16 CY17 CY18 CY19 CY20 CY21 CY22E CY13 CY14 CY15 CY16 CY17 CY18 CY19 CY20 CY21 CY22E Improving revenue growth and resilient free cash flow generation 1 Free Cash Flow = Operating Cash Flow less Capital Expenditures 26 2 CY22E is consensus estimate as of 6/9/22 $M $M
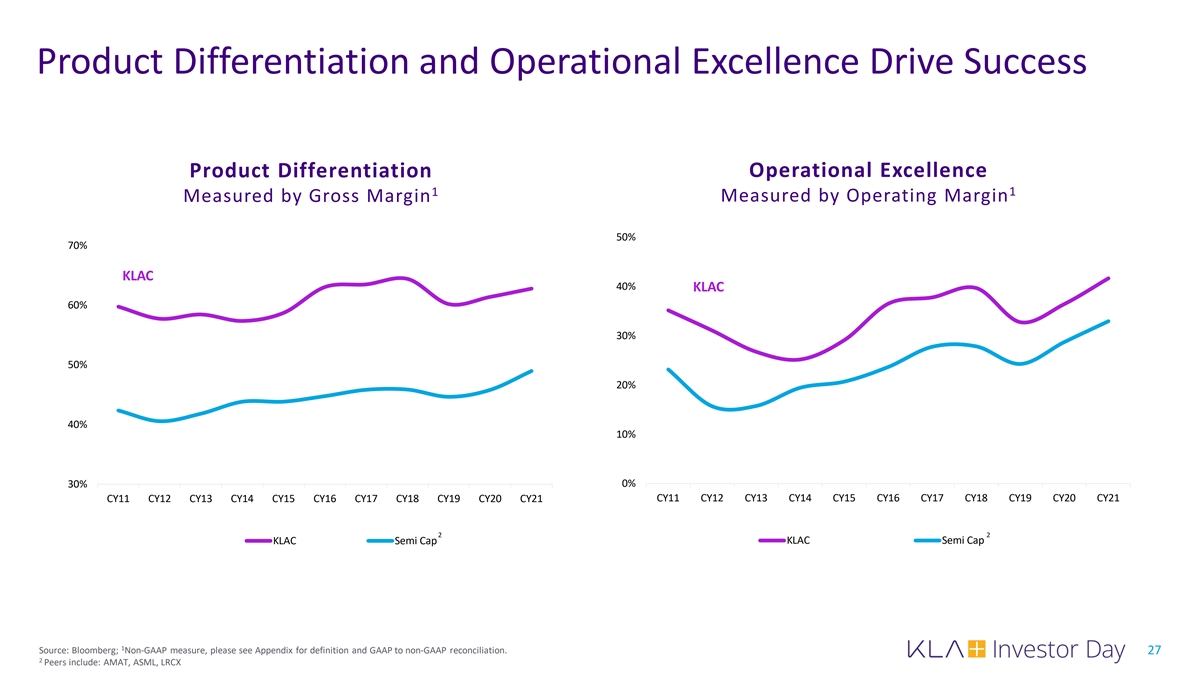
Product Differentiation and Operational Excellence Drive Success Product Differentiation Operational Excellence 1 1 Measured by Operating Margin Measured by Gross Margin 50% 70% KLAC 40% KLAC 60% 30% 50% 20% 40% 10% 30% 0% CY11 CY12 CY13 CY14 CY15 CY16 CY17 CY18 CY19 CY20 CY21 CY11 CY12 CY13 CY14 CY15 CY16 CY17 CY18 CY19 CY20 CY21 2 2 KLAC Semi Cap KLAC Semi Cap 1 Source: Bloomberg; Non-GAAP measure, please see Appendix for definition and GAAP to non-GAAP reconciliation. 27 2 Peers include: AMAT, ASML, LRCX
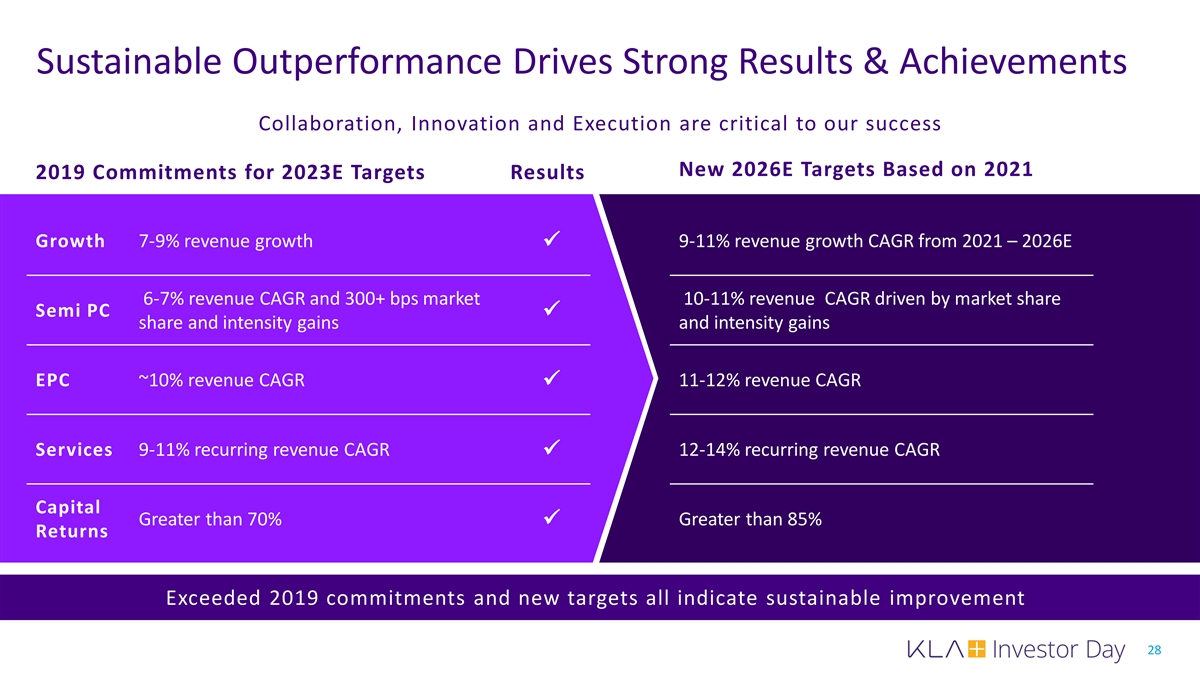
Sustainable Outperformance Drives Strong Results & Achievements Collaboration, Innovation and Execution are critical to our success New 2026E Targets Based on 2021 2019 Commitments for 2023E Targets Results Growth 7-9% revenue growth 9-11% revenue growth CAGR from 2021 – 2026E ü 6-7% revenue CAGR and 300+ bps market 10-11% revenue CAGR driven by market share Semi PCü share and intensity gains and intensity gains EPC ~10% revenue CAGR 11-12% revenue CAGR ü Services 9-11% recurring revenue CAGR 12-14% recurring revenue CAGR ü Capital Greater than 70% Greater than 85% ü Returns Exceeded 2019 commitments and new targets all indicate sustainable improvement 28
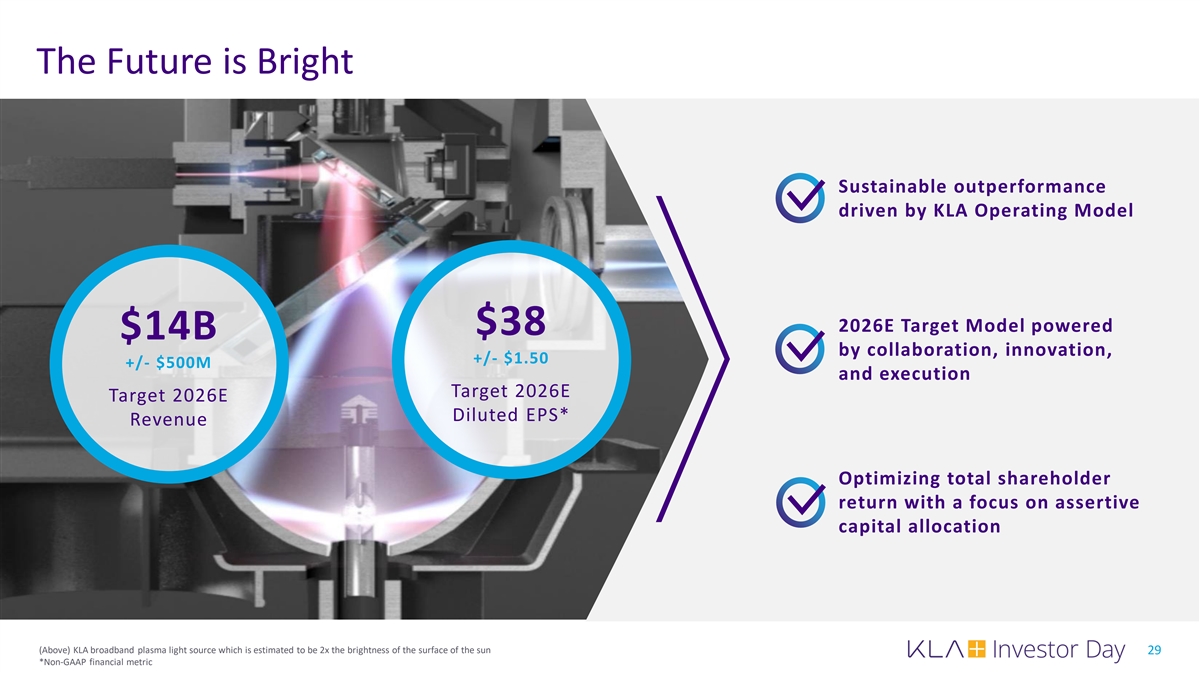
The Future is Bright Sustainable outperformance driven by KLA Operating Model 2026E Target Model powered $38 $14B by collaboration, innovation, +/- $1.50 +/- $500M and execution Target 2026E Target 2026E Diluted EPS* Revenue Optimizing total shareholder return with a focus on assertive capital allocation (Above) KLA broadband plasma light source which is estimated to be 2x the brightness of the surface of the sun 29 *Non-GAAP financial metric
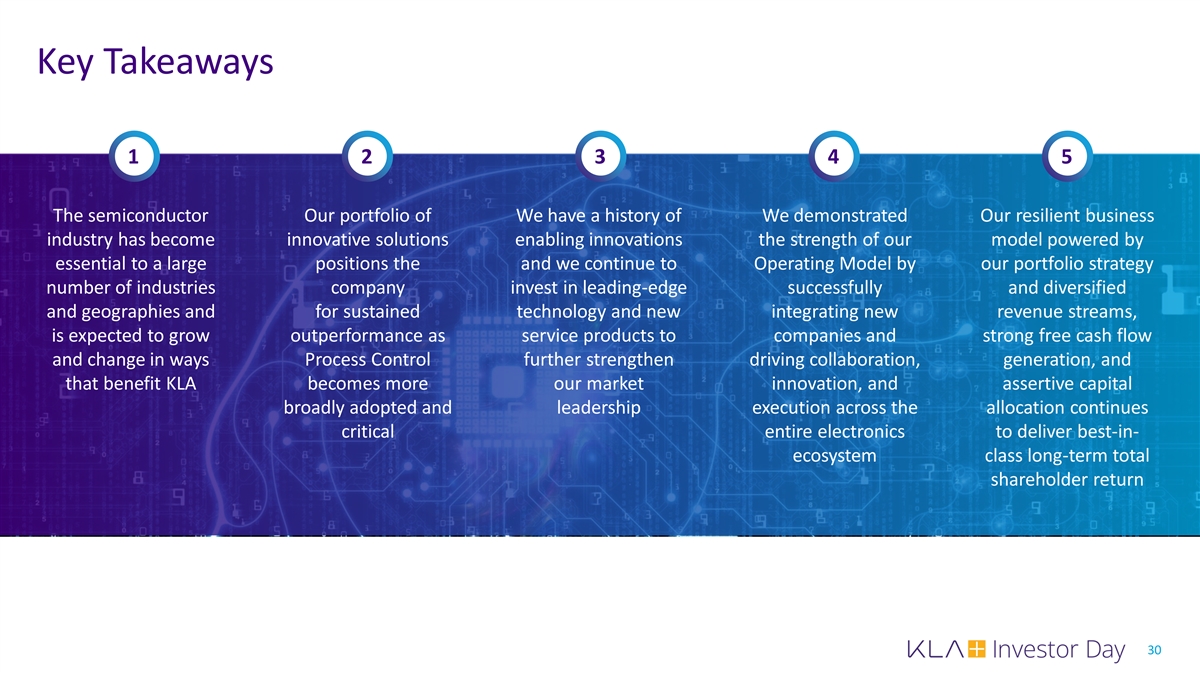
Key Takeaways 1 2 3 4 5 The semiconductor Our portfolio of We have a history of We demonstrated Our resilient business industry has become innovative solutions enabling innovations the strength of our model powered by essential to a large positions the and we continue to Operating Model by our portfolio strategy number of industries company invest in leading-edge successfully and diversified and geographies and for sustained technology and new integrating new revenue streams, is expected to grow outperformance as service products to companies and strong free cash flow and change in ways Process Control further strengthen driving collaboration, generation, and that benefit KLA becomes more our market innovation, and assertive capital broadly adopted and leadership execution across the allocation continues critical entire electronics to deliver best-in- ecosystem class long-term total shareholder return 30
Semi PC – Outperformance Roadmap Ahmad Khan President, Semiconductor Process Control
Key Messages | Semi PC Semi PC enables chip manufacturing success with the broadest portfolio of 1 highly differentiated inspection, metrology and software products Our customers use our systems to solve technology inflections in R&D, and 1 we also see increased adoption in HVM as they strive to improve yield and 2 reliability on ever increasingly complex devices We create deep customer relationships to understand key challenges and deliver the required process control solutions at the right time; our customers 3 have an insatiable demand for next generation products We expect sustainable outperformance driven by Semi PC R&D investment, unique expert talent, deep partnerships with our key suppliers; all leveraged 4 within the KLA Operating Model for continued repeatable product success Achieving sustained outperformance with extensive process control portfolio 1 HVM: high volume manufacturing 32
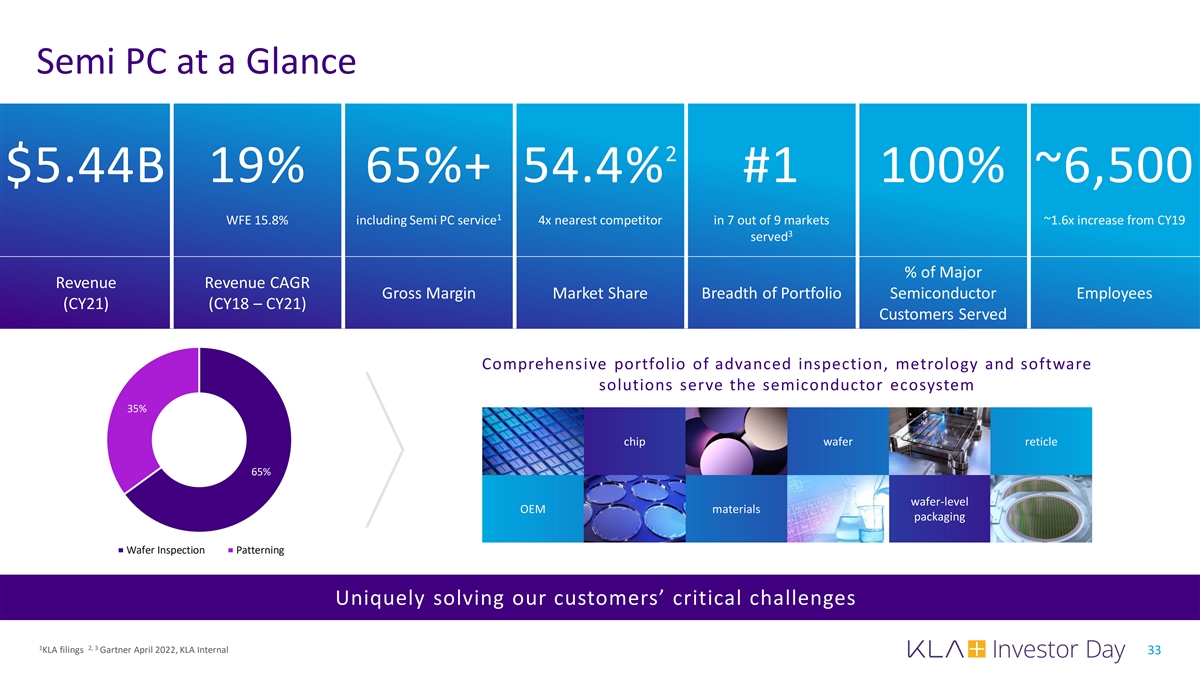
Semi PC at a Glance 2 $5.44B 19% 65%+ 54.4% #1 100% ~6,500 1 WFE 15.8% including Semi PC service 4x nearest competitor in 7 out of 9 markets ~1.6x increase from CY19 3 served % of Major Revenue Revenue CAGR Gross Margin Market Share Breadth of Portfolio Semiconductor Employees (CY21) (CY18 – CY21) Customers Served Comprehensive portfolio of advanced inspection, metrology and software solutions serve the semiconductor ecosystem 35% chip wafer reticle 65% wafer-level OEM materials packaging Wafer Inspection Patterning Uniquely solving our customers’ critical challenges 1 2, 3 KLA filings Gartner April 2022, KLA Internal 33
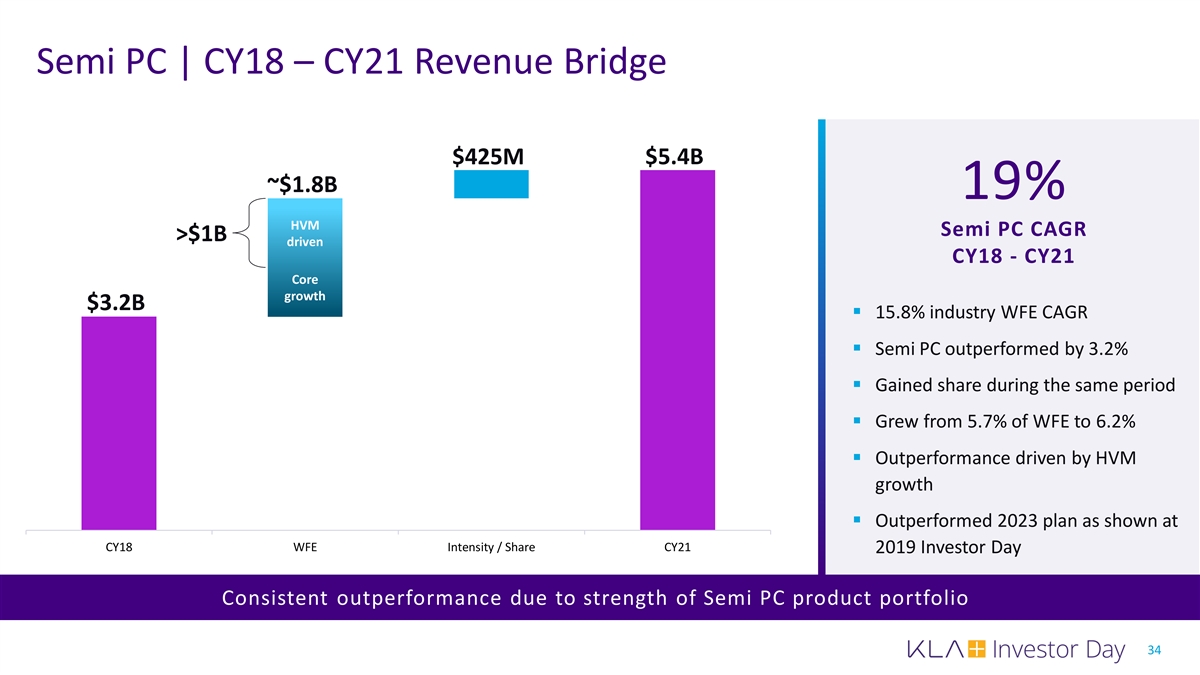
Semi PC | CY18 – CY21 Revenue Bridge $425M $5.4B ~$1.8B 19% HVM Semi PC CAGR >$1B driven CY18 - CY21 Core growth $3.2B § 15.8% industry WFE CAGR § Semi PC outperformed by 3.2% § Gained share during the same period § Grew from 5.7% of WFE to 6.2% § Outperformance driven by HVM growth § Outperformed 2023 plan as shown at CY18 WFE Intensity / Share CY21 2019 Investor Day Consistent outperformance due to strength of Semi PC product portfolio 34
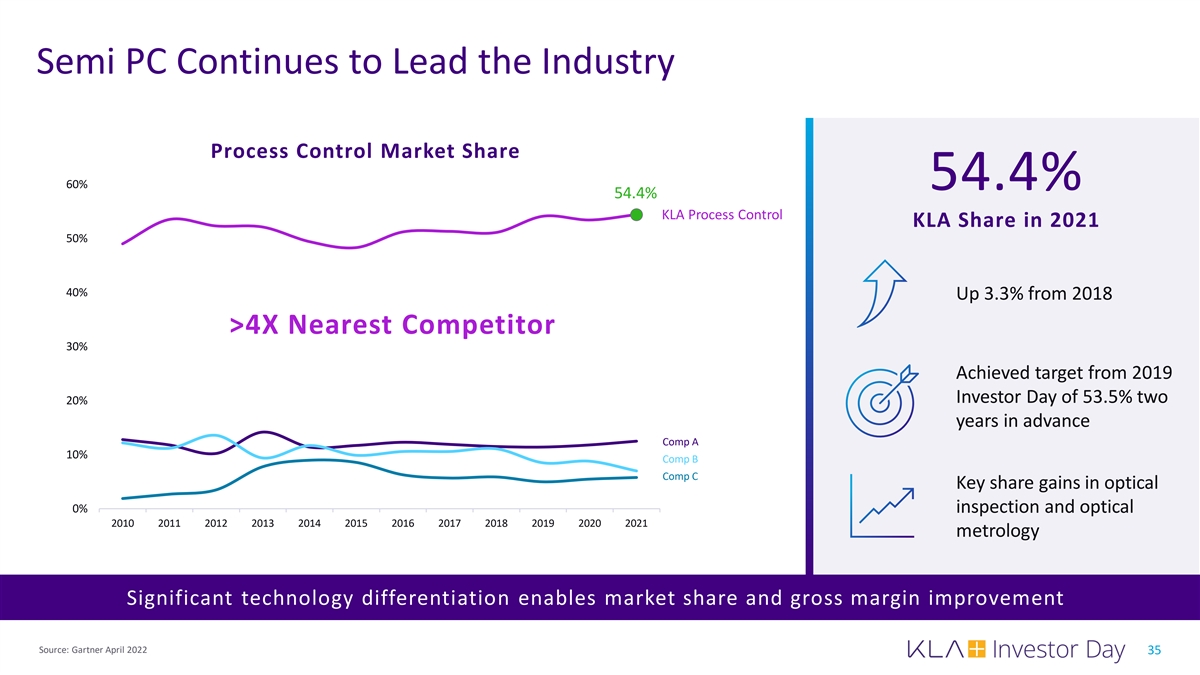
Semi PC Continues to Lead the Industry Process Control Market Share 60% 54.4% 54.4% KLA Process Control KLA Share in 2021 50% 40% Up 3.3% from 2018 >4X Nearest Competitor 30% Achieved target from 2019 Investor Day of 53.5% two 20% years in advance Comp A 10% Comp B Comp C Key share gains in optical 0% inspection and optical 2010 2011 2012 2013 2014 2015 2016 2017 2018 2019 2020 2021 metrology Significant technology differentiation enables market share and gross margin improvement Source: Gartner April 2022 35
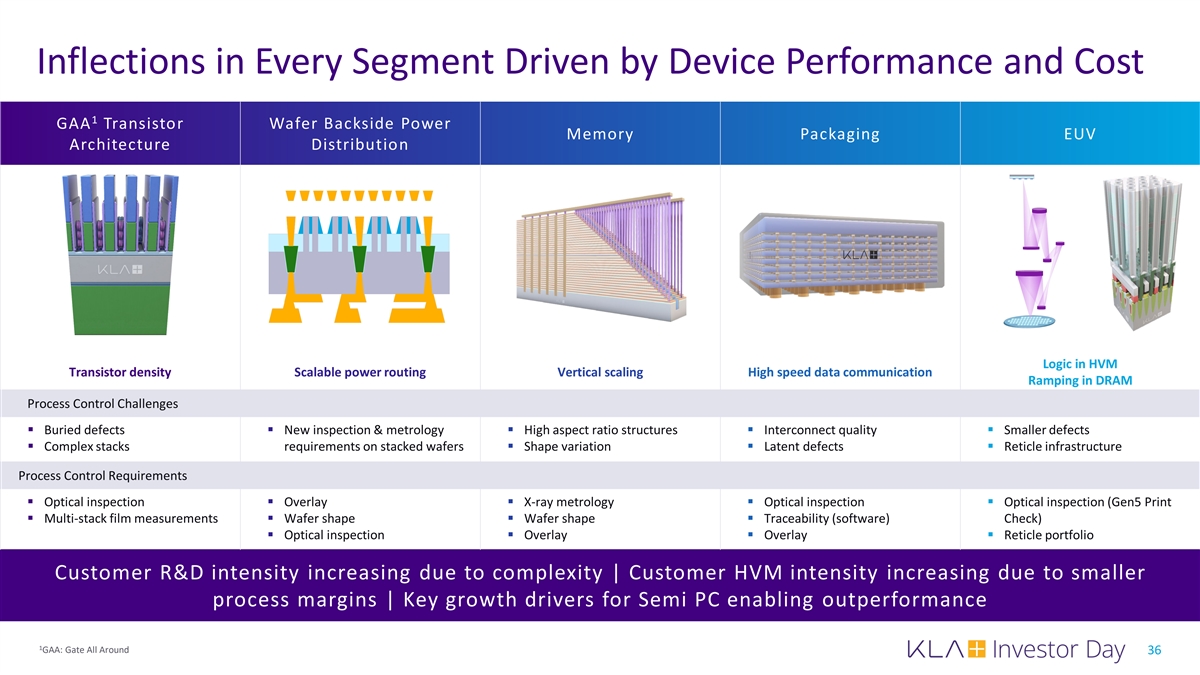
Inflections in Every Segment Driven by Device Performance and Cost 1 GAA Transistor Wafer Backside Power Memory Packaging EUV Architecture Distribution Logic in HVM Transistor density Scalable power routing Vertical scaling High speed data communication Ramping in DRAM Process Control Challenges § Buried defects§ New inspection & metrology § High aspect ratio structures§ Interconnect quality§ Smaller defects § Complex stacks requirements on stacked wafers§ Shape variation§ Latent defects§ Reticle infrastructure Process Control Requirements § Optical inspection§ Overlay§ X-ray metrology§ Optical inspection§ Optical inspection (Gen5 Print § Multi-stack film measurements§ Wafer shape§ Wafer shape§ Traceability (software) Check) § Optical inspection§ Overlay§ Overlay§ Reticle portfolio Customer R&D intensity increasing due to complexity | Customer HVM intensity increasing due to smaller process margins | Key growth drivers for Semi PC enabling outperformance 1 GAA: Gate All Around 36
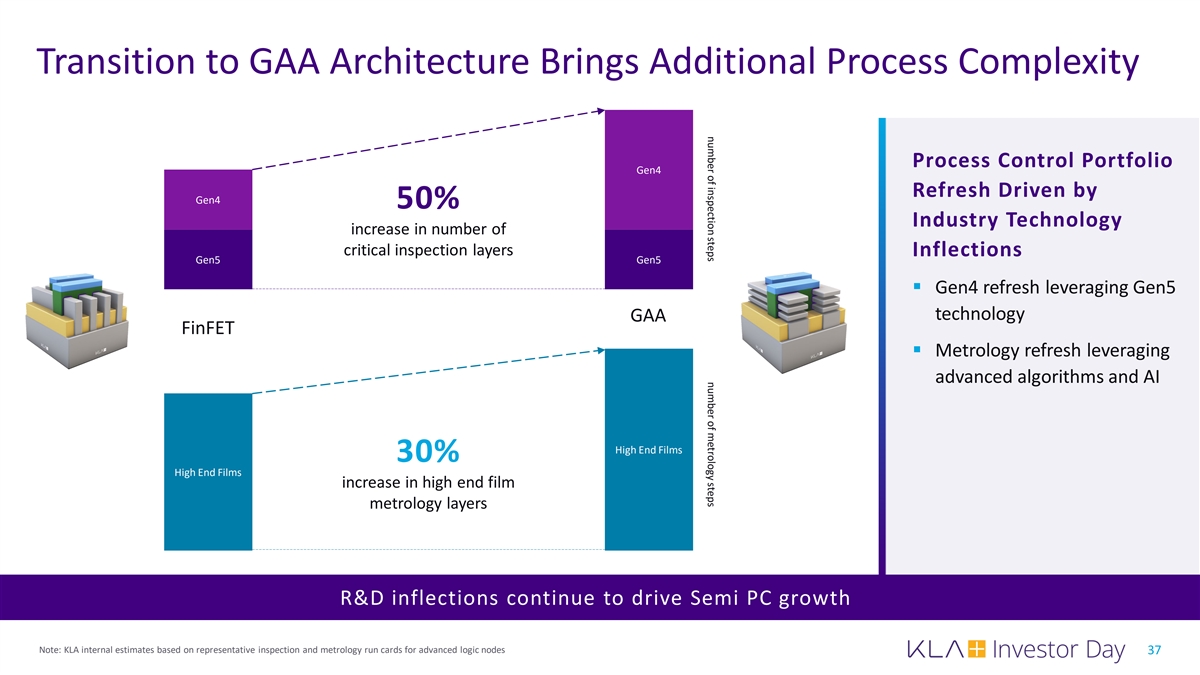
number of inspection steps number of metrology steps Transition to GAA Architecture Brings Additional Process Complexity Process Control Portfolio Gen4 Refresh Driven by Gen4 50% Industry Technology increase in number of critical inspection layers Inflections Gen5 Gen5 § Gen4 refresh leveraging Gen5 technology GAA FinFET § Metrology refresh leveraging advanced algorithms and AI High End Films 30% High End Films increase in high end film metrology layers R&D inflections continue to drive Semi PC growth Note: KLA internal estimates based on representative inspection and metrology run cards for advanced logic nodes 37
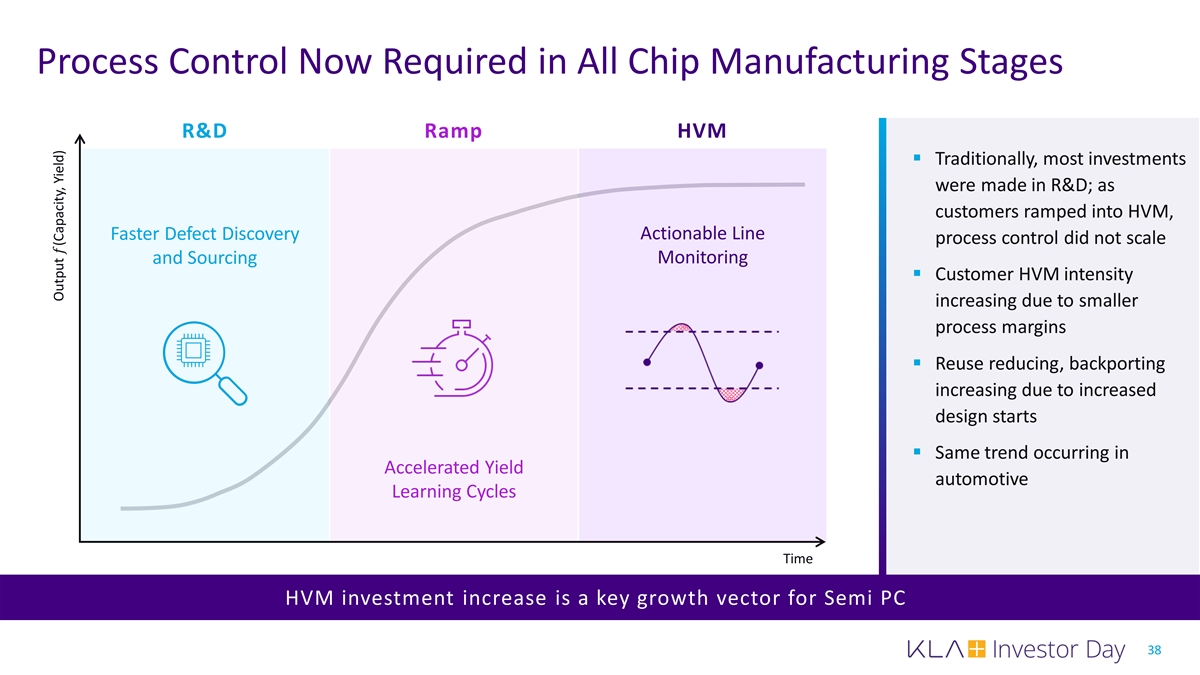
Process Control Now Required in All Chip Manufacturing Stages R&D Ramp HVM § Traditionally, most investments were made in R&D; as customers ramped into HVM, Faster Defect Discovery Actionable Line process control did not scale ���� and Sourcing Monitoring § Customer HVM intensity increasing due to smaller process margins § Reuse reducing, backporting increasing due to increased design starts § Same trend occurring in Accelerated Yield automotive Learning Cycles Time HVM investment increase is a key growth vector for Semi PC 38 Output (Capacity, Yield)
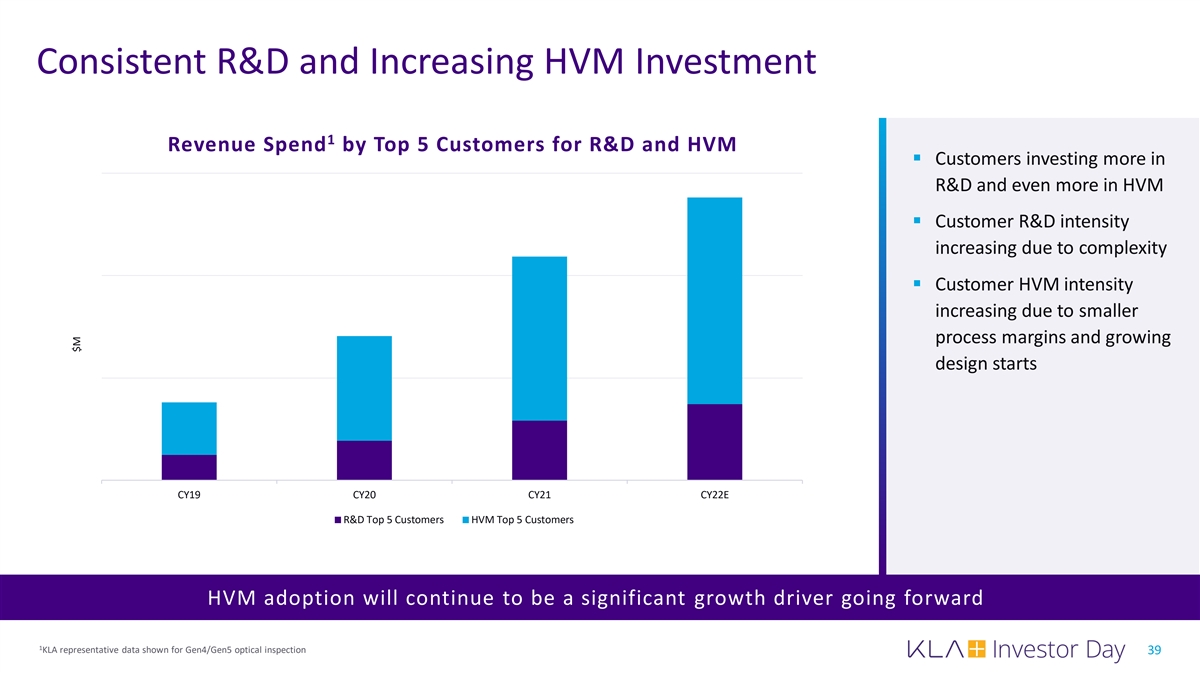
Consistent R&D and Increasing HVM Investment 1 Revenue Spend by Top 5 Customers for R&D and HVM § Customers investing more in R&D and even more in HVM § Customer R&D intensity increasing due to complexity § Customer HVM intensity increasing due to smaller process margins and growing design starts CY19 CY20 CY21 CY22E R&D Top 5 Customers HVM Top 5 Customers HVM adoption will continue to be a significant growth driver going forward 1 KLA representative data shown for Gen4/Gen5 optical inspection 39 $M
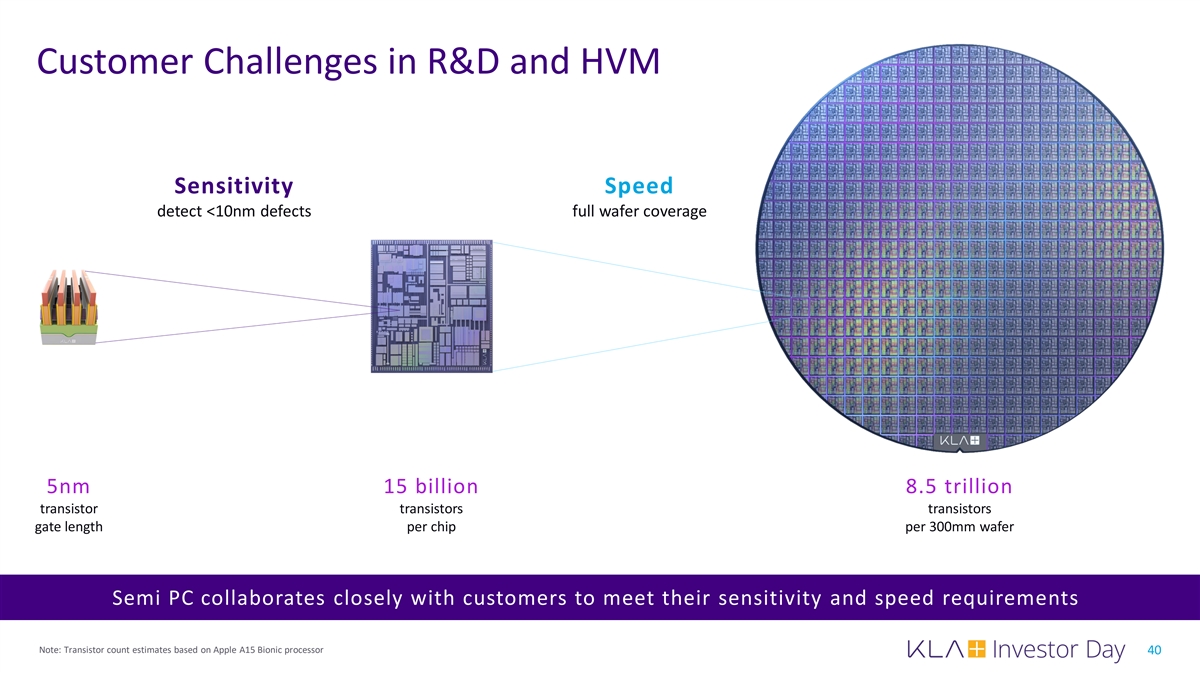
Customer Challenges in R&D and HVM Sensitivity Speed detect <10nm defects full wafer coverage 5nm 15 billion 8.5 trillion transistor transistors transistors gate length per chip per 300mm wafer Semi PC collaborates closely with customers to meet their sensitivity and speed requirements Note: Transistor count estimates based on Apple A15 Bionic processor 40
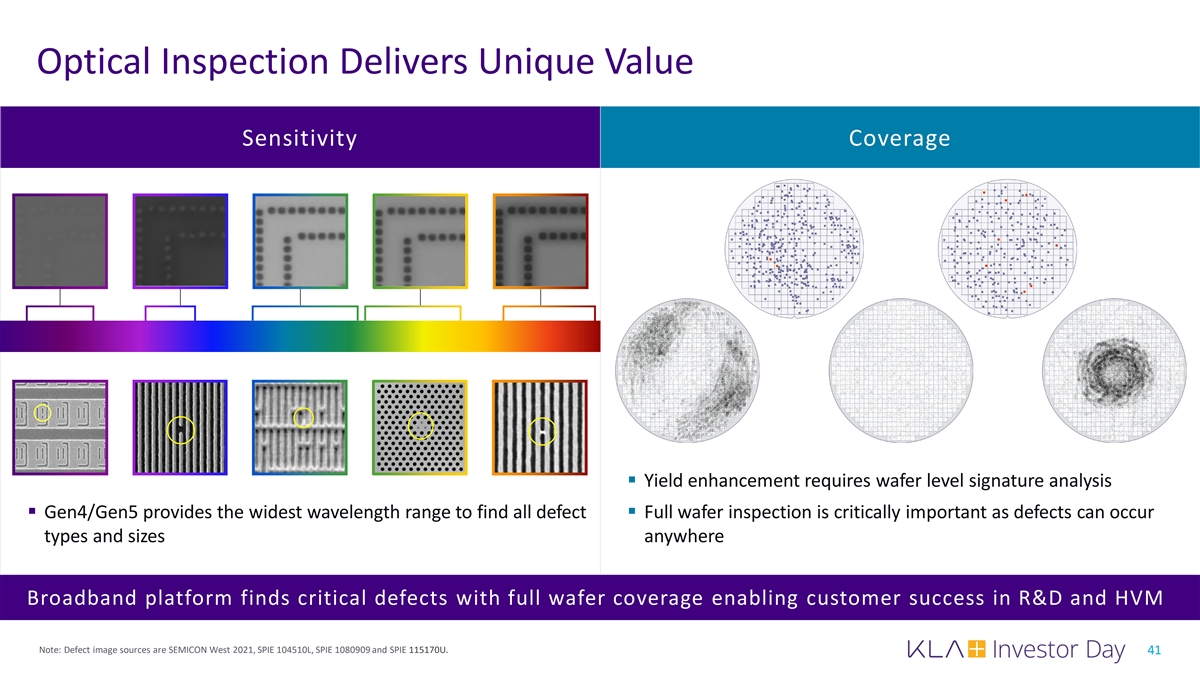
Optical Inspection Delivers Unique Value Sensitivity Coverage § Yield enhancement requires wafer level signature analysis § Gen4/Gen5 provides the widest wavelength range to find all defect § Full wafer inspection is critically important as defects can occur types and sizes anywhere Broadband platform finds critical defects with full wafer coverage enabling customer success in R&D and HVM Note: Defect image sources are SEMICON West 2021, SPIE 104510L, SPIE 1080909 and SPIE 115170U. 41
42
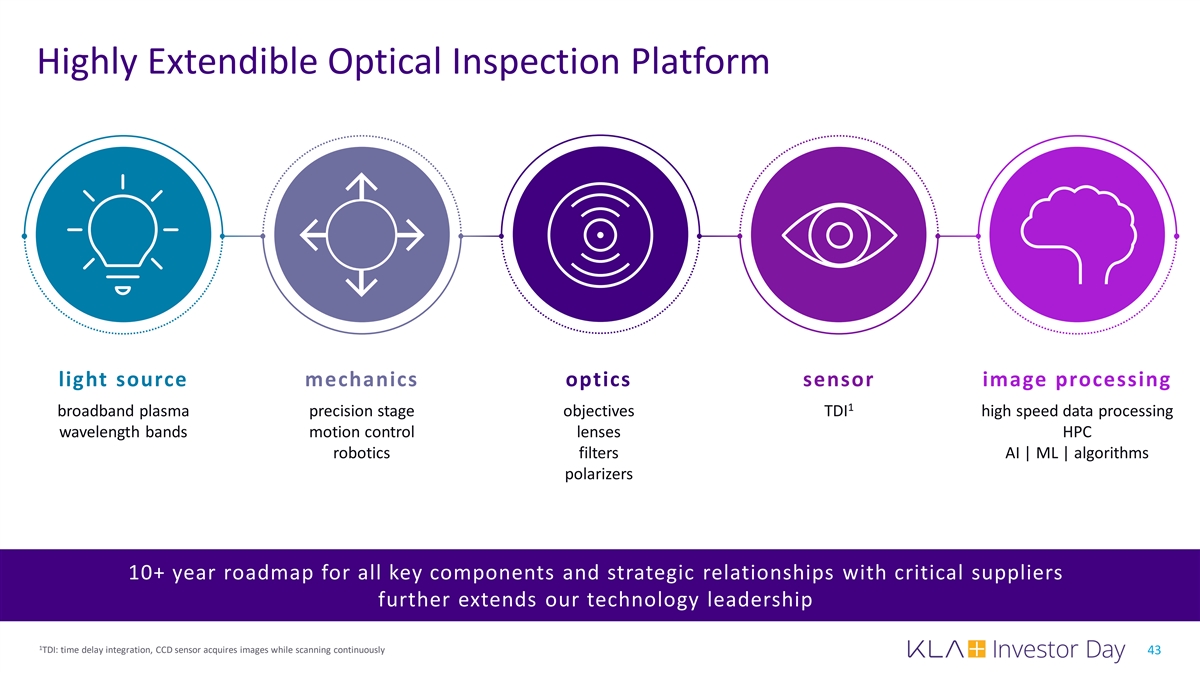
Highly Extendible Optical Inspection Platform light source mechanics optics sensor image processing 1 broadband plasma precision stage objectives TDI high speed data processing wavelength bands motion control lenses HPC robotics filters AI | ML | algorithms polarizers 10+ year roadmap for all key components and strategic relationships with critical suppliers further extends our technology leadership 1 TDI: time delay integration, CCD sensor acquires images while scanning continuously 43
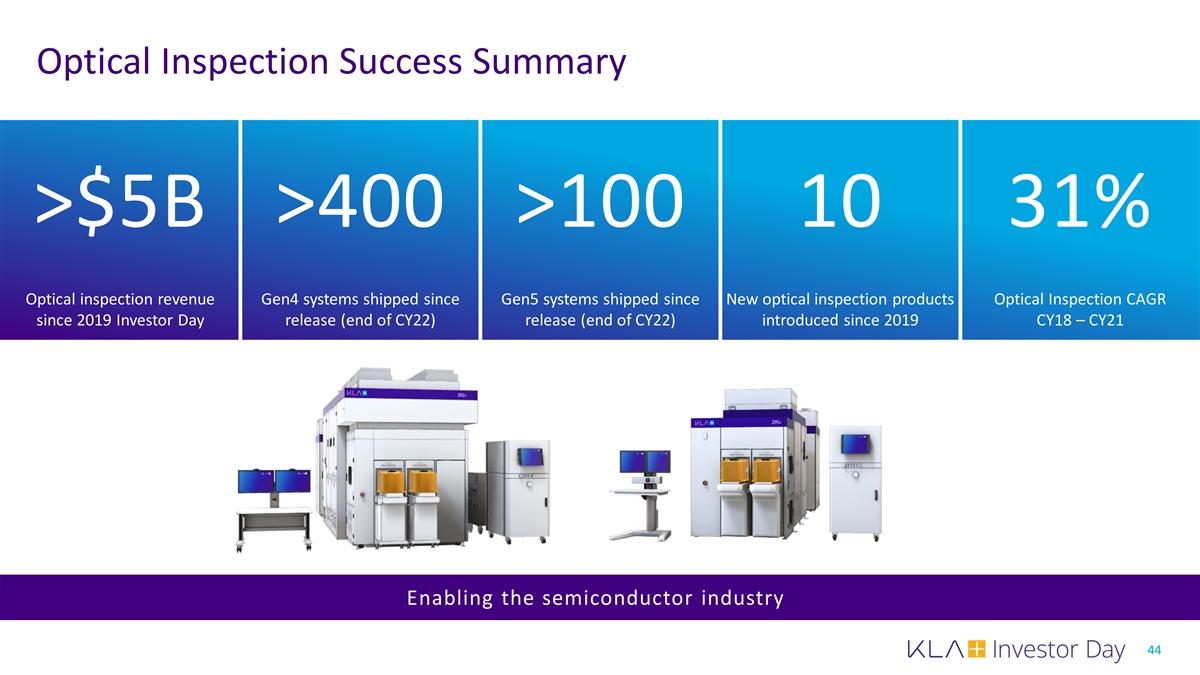
Optical Inspection Success Summary >$5B >400 >100 10 31% Optical inspection revenue Gen4 systems shipped since Gen5 systems shipped since New optical inspection products Optical Inspection CAGR since 2019 Investor Day release (end of CY22) release (end of CY22) introduced since 2019 CY18 – CY21 Enabling the semiconductor industry 44
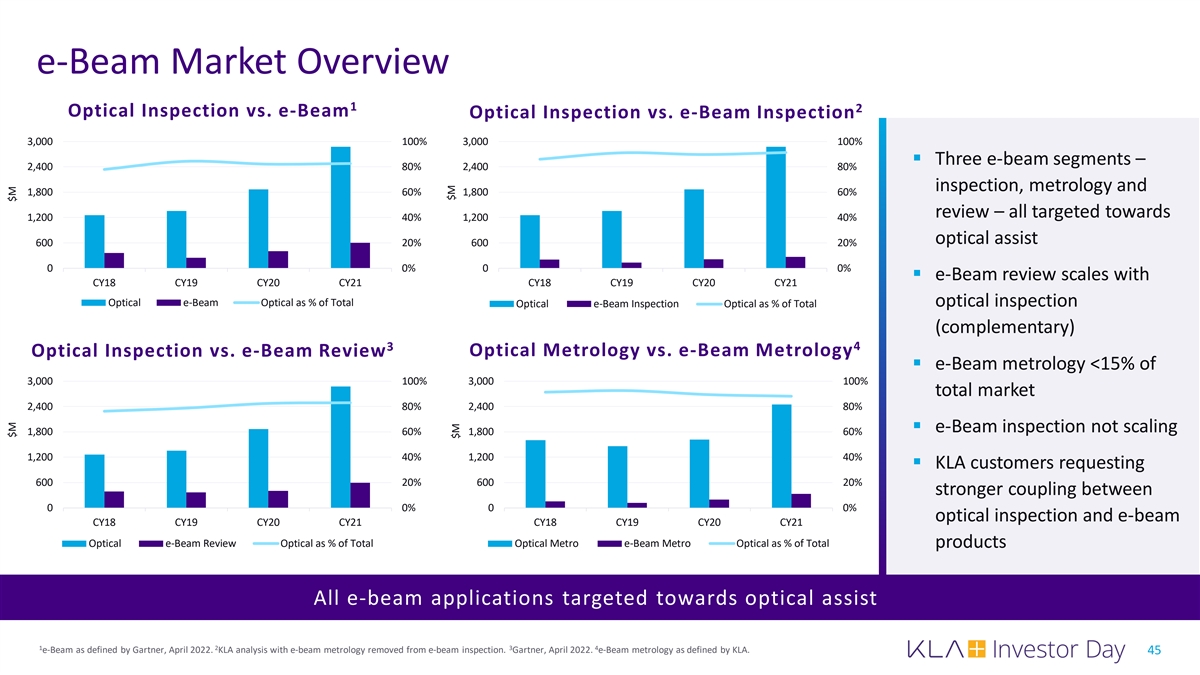
e-Beam Market Overview 1 2 Optical Inspection vs. e-Beam Optical Inspection vs. e-Beam Inspection 3,000 100% 3,000 100% § Three e-beam segments – 2,400 80% 2,400 80% inspection, metrology and 1,800 60% 1,800 60% review – all targeted towards 1,200 40% 1,200 40% optical assist 600 20% 600 20% 0 0% 0 0% § e-Beam review scales with CY18 CY19 CY20 CY21 CY18 CY19 CY20 CY21 Optical e-Beam Optical as % of Total optical inspection Optical e-Beam Inspection Optical as % of Total (complementary) 4 3 Optical Metrology vs. e-Beam Metrology Optical Inspection vs. e-Beam Review § e-Beam metrology <15% of 3,000 100% 3,000 100% total market 2,400 80% 2,400 80% § e-Beam inspection not scaling 1,800 60% 1,800 60% 1,200 40% 1,200 40% § KLA customers requesting 600 20% 600 20% stronger coupling between 0 0% 0 0% optical inspection and e-beam CY18 CY19 CY20 CY21 CY18 CY19 CY20 CY21 Optical e-Beam Review Optical as % of Total Optical Metro e-Beam Metro Optical as % of Total products All e-beam applications targeted towards optical assist 1 2 3 4 e-Beam as defined by Gartner, April 2022. KLA analysis with e-beam metrology removed from e-beam inspection. Gartner, April 2022. e-Beam metrology as defined by KLA. 45 $M $M $M $M
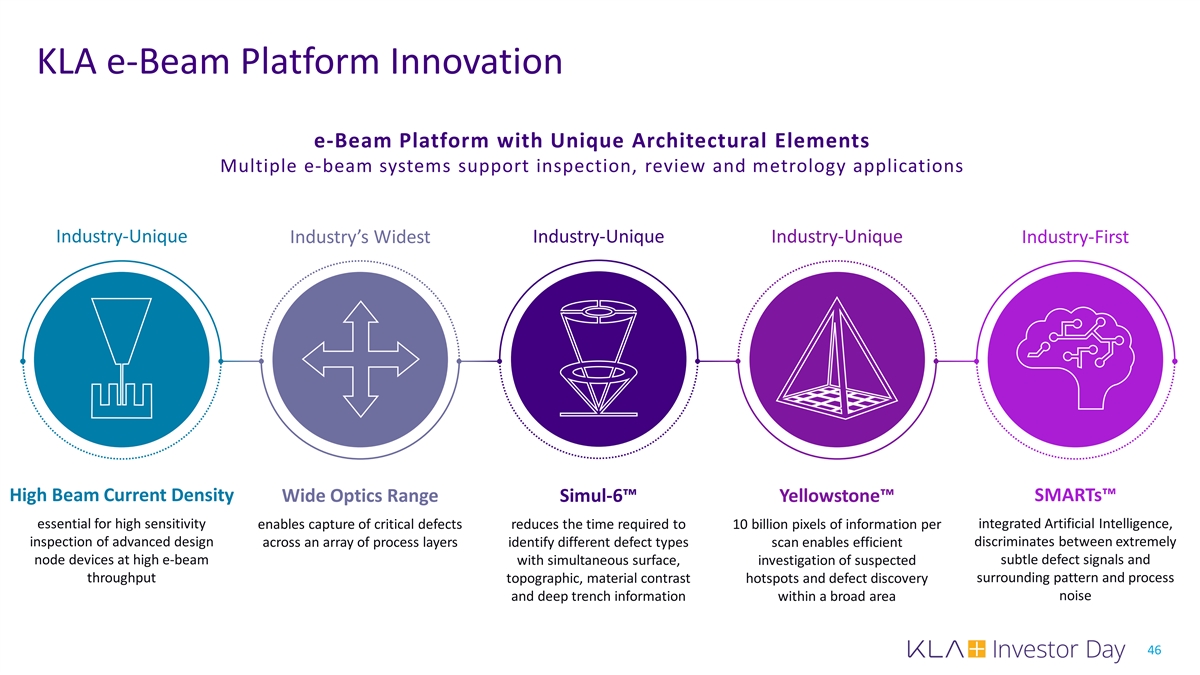
KLA e-Beam Platform Innovation e-Beam Platform with Unique Architectural Elements Multiple e-beam systems support inspection, review and metrology applications Industry-Unique Industry-Unique Industry-Unique Industry’s Widest Industry-First High Beam Current Density SMARTs™ Wide Optics Range Simul-6™ Yellowstone™ essential for high sensitivity enables capture of critical defects reduces the time required to 10 billion pixels of information per integrated Artificial Intelligence, inspection of advanced design discriminates between extremely across an array of process layers identify different defect types scan enables efficient node devices at high e-beam with simultaneous surface, investigation of suspected subtle defect signals and throughput topographic, material contrast surrounding pattern and process hotspots and defect discovery noise and deep trench information within a broad area 46
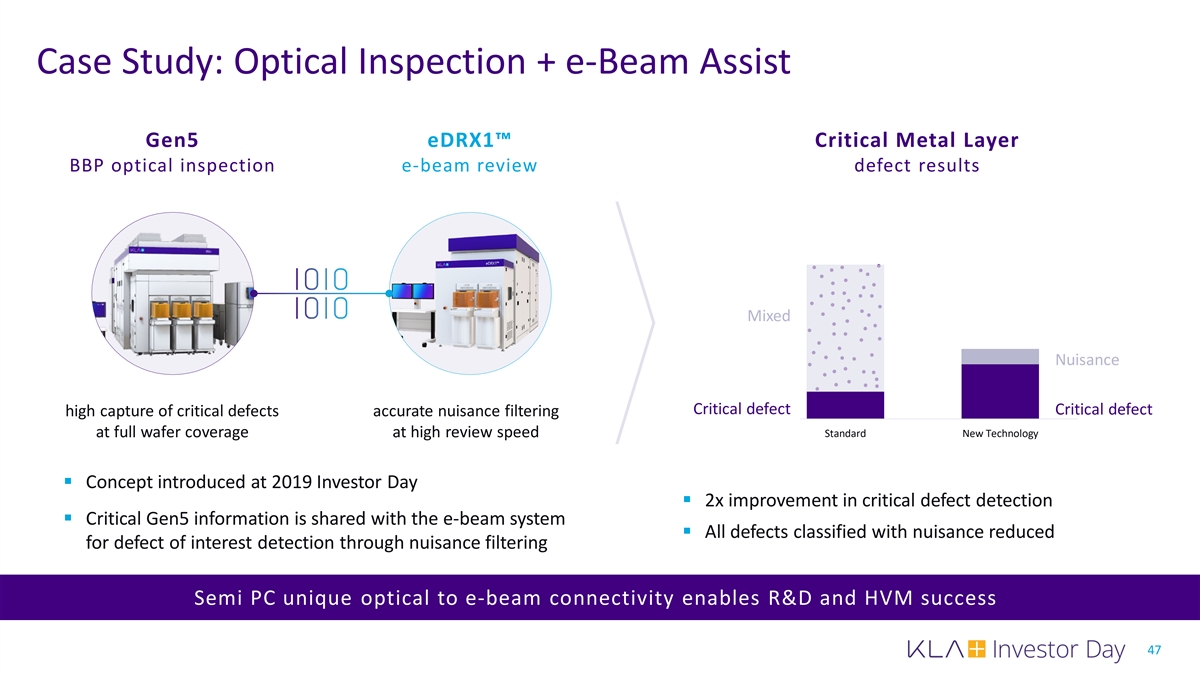
Case Study: Optical Inspection + e-Beam Assist Gen5 eDRX1™ Critical Metal Layer BBP optical inspection e-beam review defect results Mixed Nuisance Critical defect Critical defect high capture of critical defects accurate nuisance filtering at full wafer coverage at high review speed Standard New Technology § Concept introduced at 2019 Investor Day § 2x improvement in critical defect detection § Critical Gen5 information is shared with the e-beam system § All defects classified with nuisance reduced for defect of interest detection through nuisance filtering Semi PC unique optical to e-beam connectivity enables R&D and HVM success 47
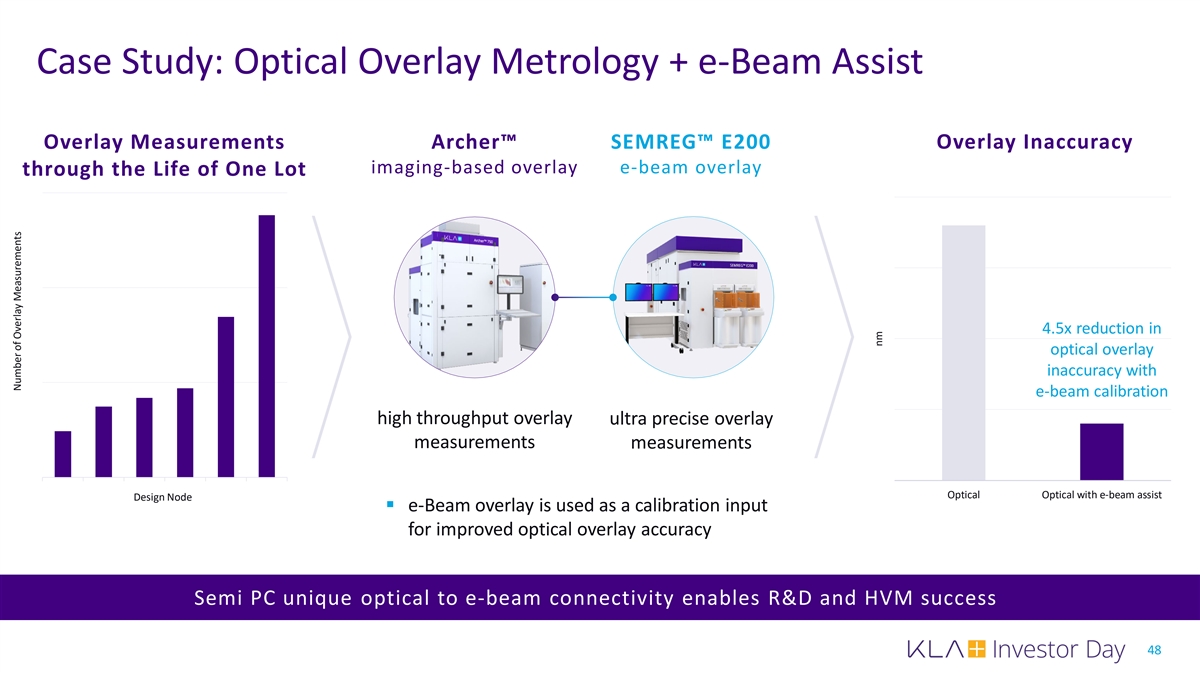
Case Study: Optical Overlay Metrology + e-Beam Assist Overlay Measurements Archer™ SEMREG™ E200 Overlay Inaccuracy imaging-based overlay e-beam overlay through the Life of One Lot 4.5x reduction in optical overlay inaccuracy with e-beam calibration high throughput overlay ultra precise overlay measurements measurements Optical Optical with e-beam assist Design Node § e-Beam overlay is used as a calibration input for improved optical overlay accuracy Semi PC unique optical to e-beam connectivity enables R&D and HVM success 48 Number of Overlay Measurements nm
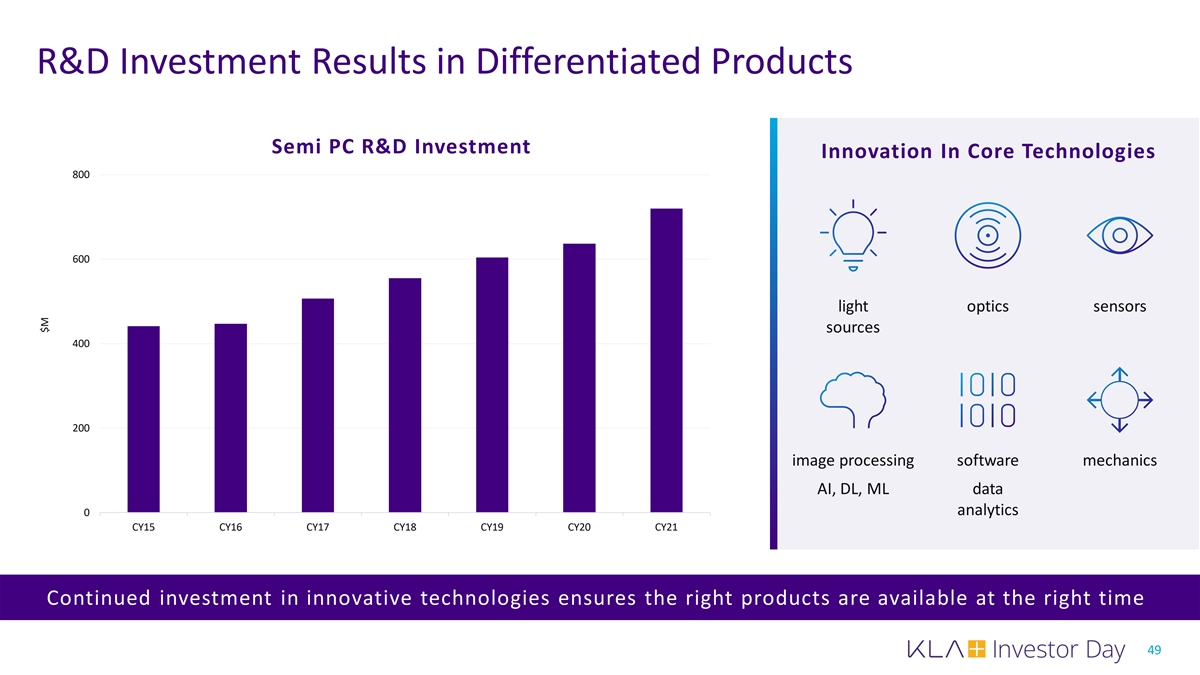
R&D Investment Results in Differentiated Products Semi PC R&D Investment Innovation In Core Technologies 800 600 light optics sensors sources 400 200 image processing software mechanics AI, DL, ML data analytics 0 CY15 CY16 CY17 CY18 CY19 CY20 CY21 Continued investment in innovative technologies ensures the right products are available at the right time 49 $M
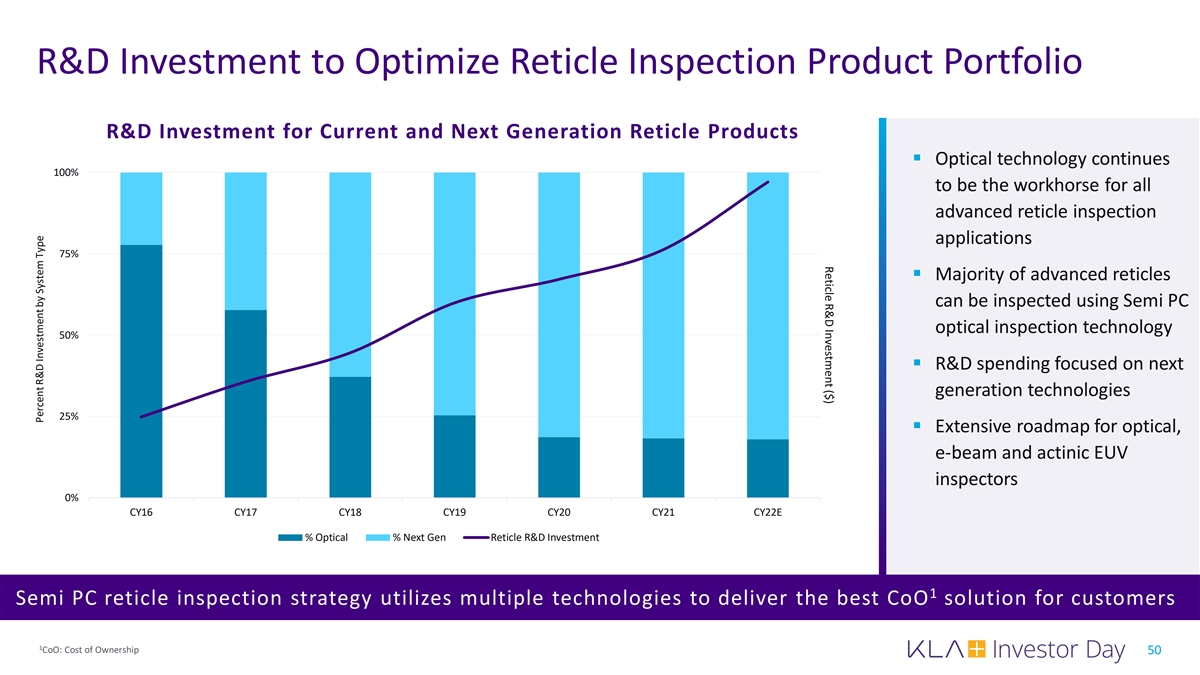
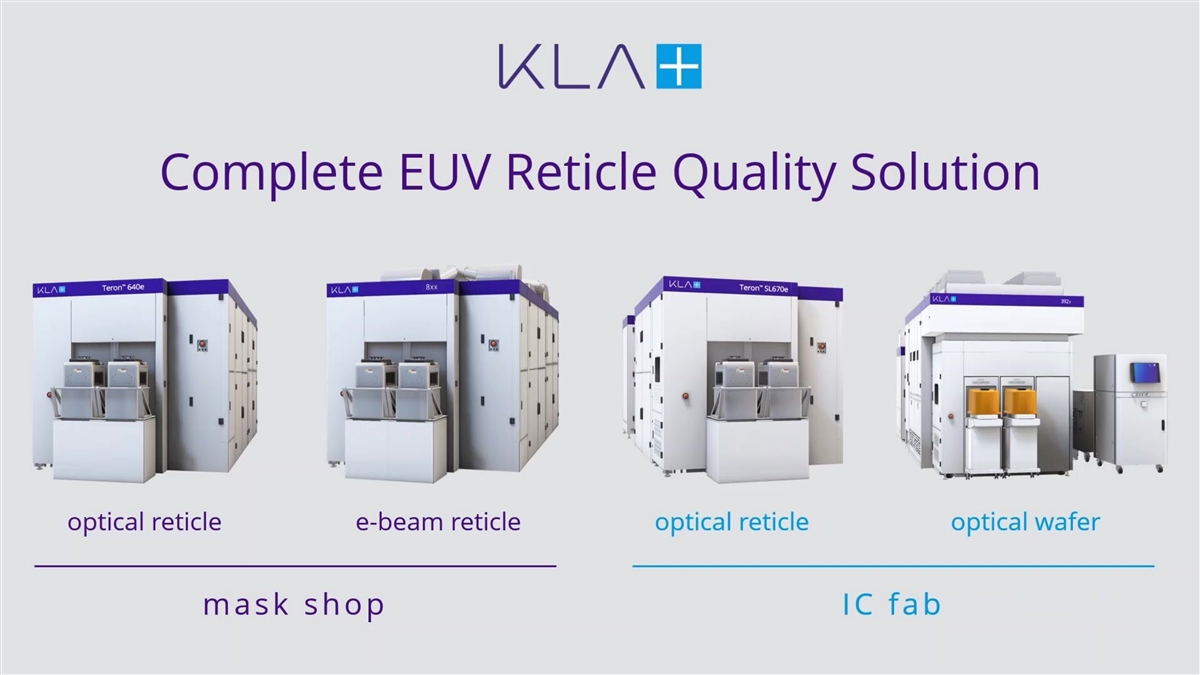
Reticle R&D Investment ($) R&D Investment to Optimize Reticle Inspection Product Portfolio R&D Investment for Current and Next Generation Reticle Products § Optical technology continues 100% to be the workhorse for all advanced reticle inspection applications 75% § Majority of advanced reticles can be inspected using Semi PC optical inspection technology 50% § R&D spending focused on next generation technologies 25% § Extensive roadmap for optical, e-beam and actinic EUV inspectors 0% CY16 CY17 CY18 CY19 CY20 CY21 CY22E % Optical % Next Gen Reticle R&D Investment 1 Semi PC reticle inspection strategy utilizes multiple technologies to deliver the best CoO solution for customers 1 CoO: Cost of Ownership 50 Percent R&D Investment by System Type
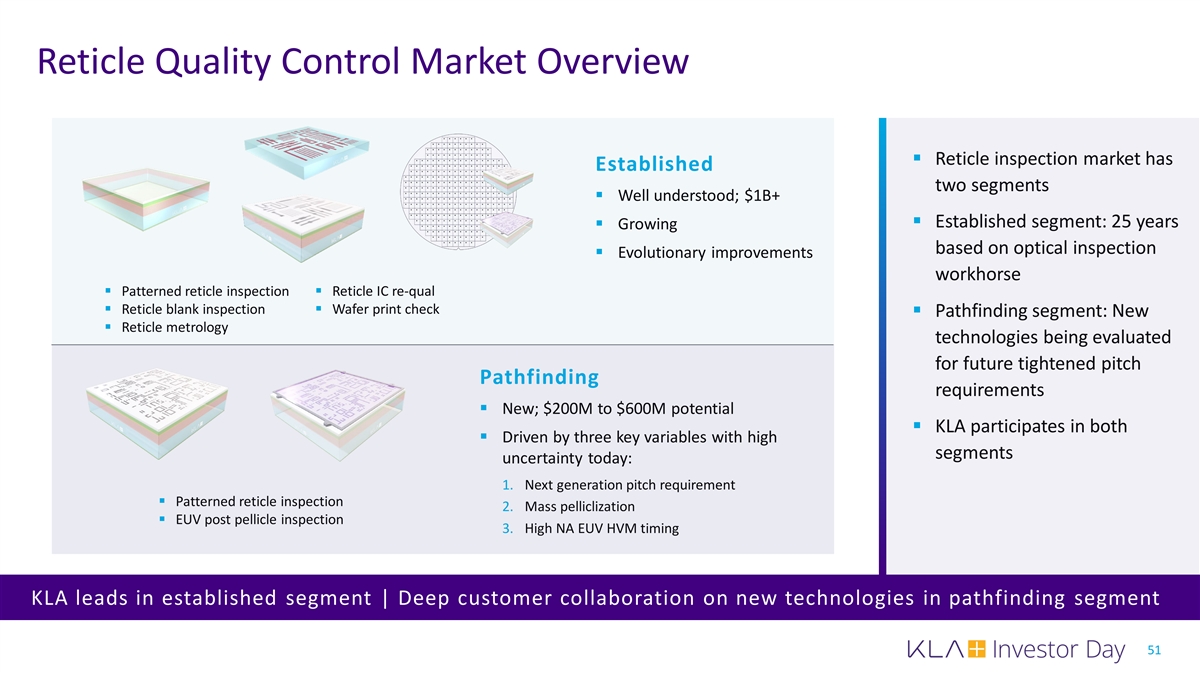
Reticle Quality Control Market Overview § Reticle inspection market has Established two segments § Well understood; $1B+ § Established segment: 25 years § Growing based on optical inspection § Evolutionary improvements workhorse § Patterned reticle inspection§ Reticle IC re-qual § Reticle blank inspection§ Wafer print check § Pathfinding segment: New § Reticle metrology technologies being evaluated for future tightened pitch Pathfinding requirements § New; $200M to $600M potential § KLA participates in both § Driven by three key variables with high segments uncertainty today: 1. Next generation pitch requirement § Patterned reticle inspection 2. Mass pelliclization § EUV post pellicle inspection 3. High NA EUV HVM timing KLA leads in established segment | Deep customer collaboration on new technologies in pathfinding segment 51
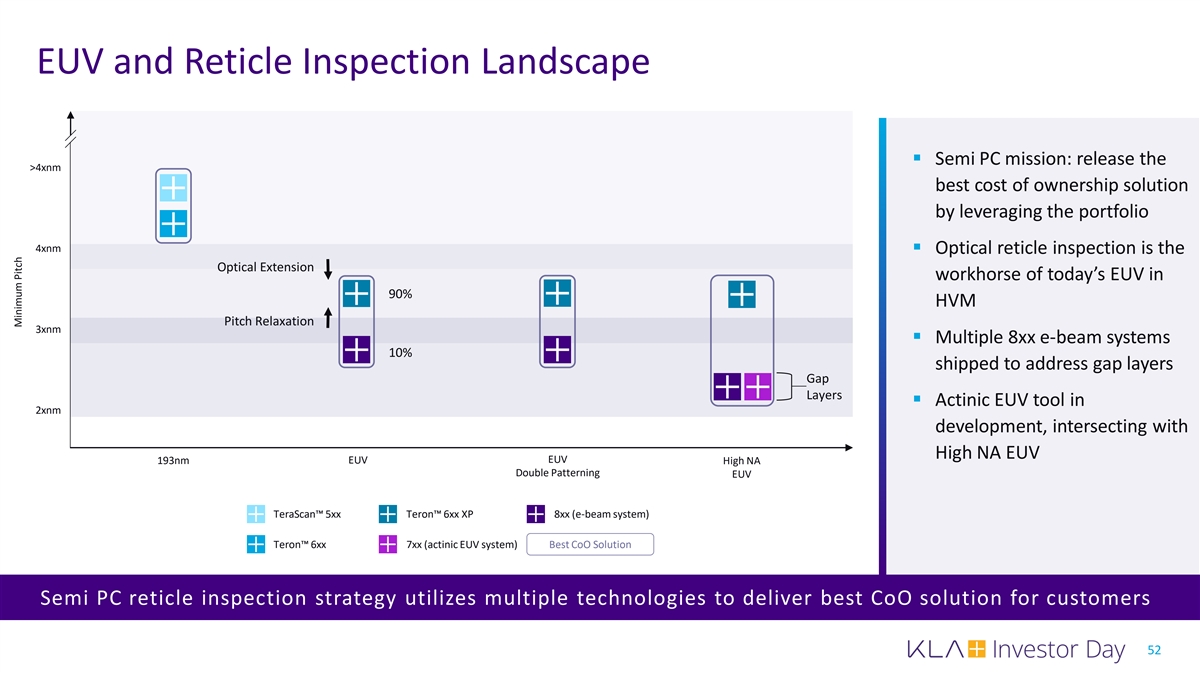
EUV and Reticle Inspection Landscape § Semi PC mission: release the >4xnm best cost of ownership solution by leveraging the portfolio 4xnm § Optical reticle inspection is the Optical Extension workhorse of today’s EUV in 90% HVM Pitch Relaxation 3xnm § Multiple 8xx e-beam systems 10% shipped to address gap layers Gap Layers § Actinic EUV tool in 2xnm development, intersecting with High NA EUV EUV 193nm EUV High NA Double Patterning EUV TeraScan™ 5xx Teron™ 6xx XP 8xx (e-beam system) Teron™ 6xx 7xx (actinic EUV system) Best CoO Solution Semi PC reticle inspection strategy utilizes multiple technologies to deliver best CoO solution for customers 52 Minimum Pitch
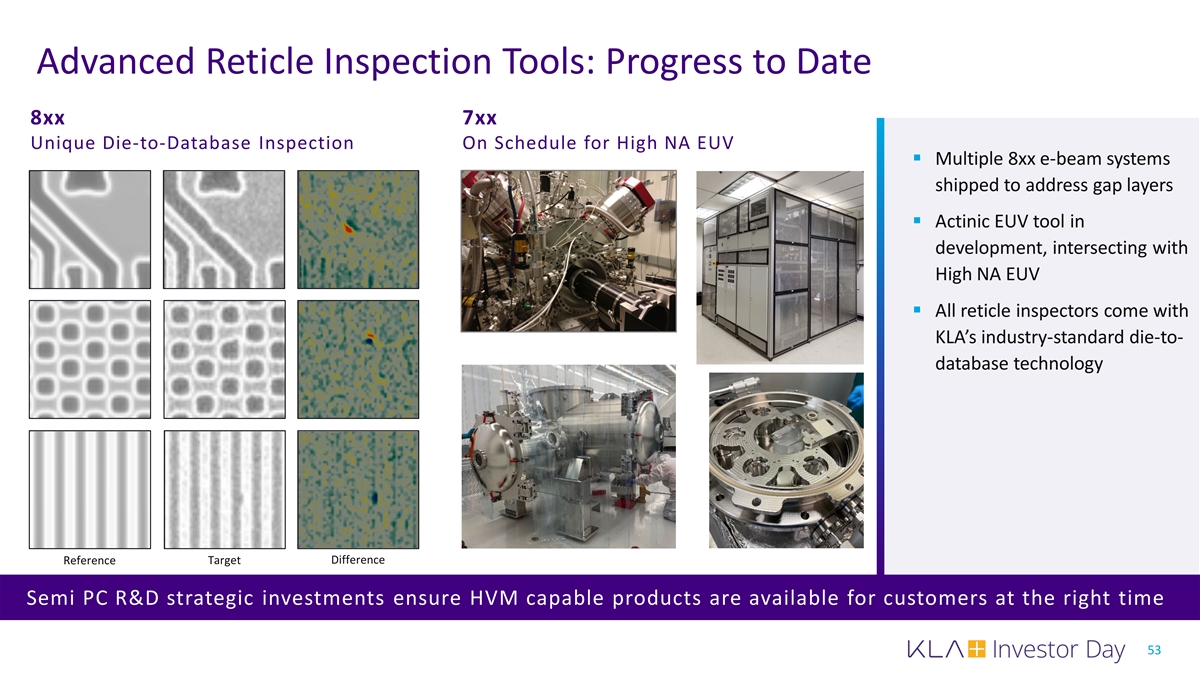
Advanced Reticle Inspection Tools: Progress to Date 8xx 7xx Unique Die-to-Database Inspection On Schedule for High NA EUV § Multiple 8xx e-beam systems shipped to address gap layers § Actinic EUV tool in development, intersecting with High NA EUV § All reticle inspectors come with KLA’s industry-standard die-to- database technology Target Difference Reference Semi PC R&D strategic investments ensure HVM capable products are available for customers at the right time 53
54
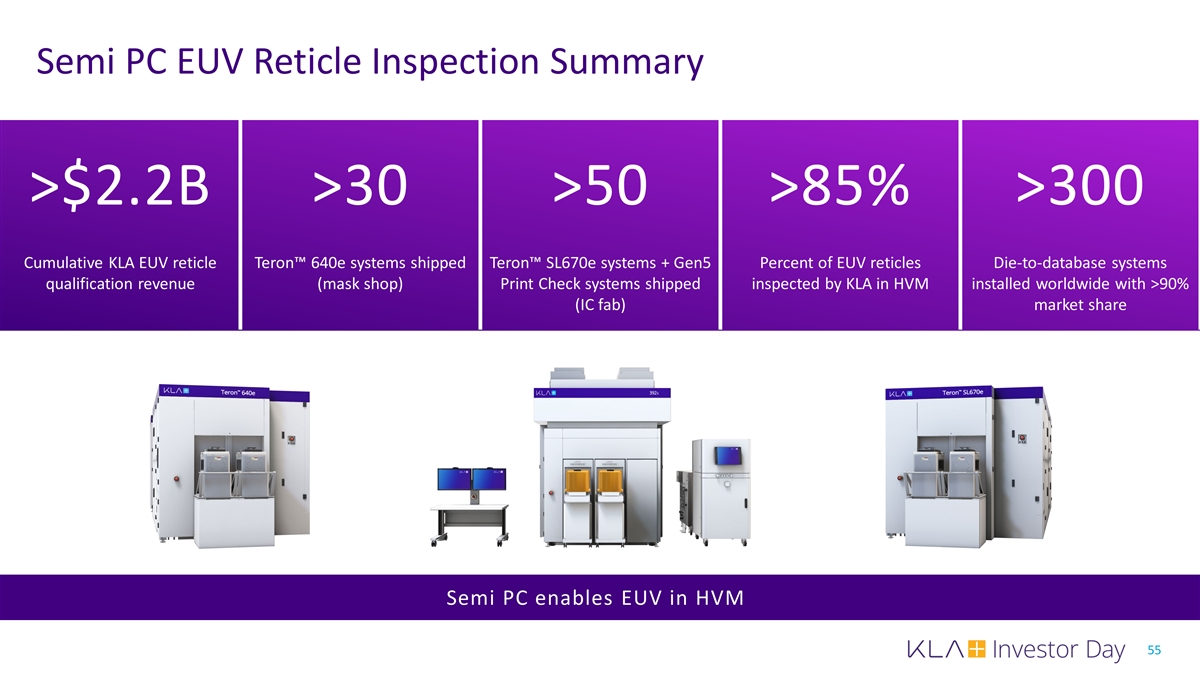
Semi PC EUV Reticle Inspection Summary >$2.2B >30 >50 >85% >300 Cumulative KLA EUV reticle Teron™ 640e systems shipped Teron™ SL670e systems + Gen5 Percent of EUV reticles Die-to-database systems qualification revenue (mask shop) Print Check systems shipped inspected by KLA in HVM installed worldwide with >90% (IC fab) market share Semi PC enables EUV in HVM 55
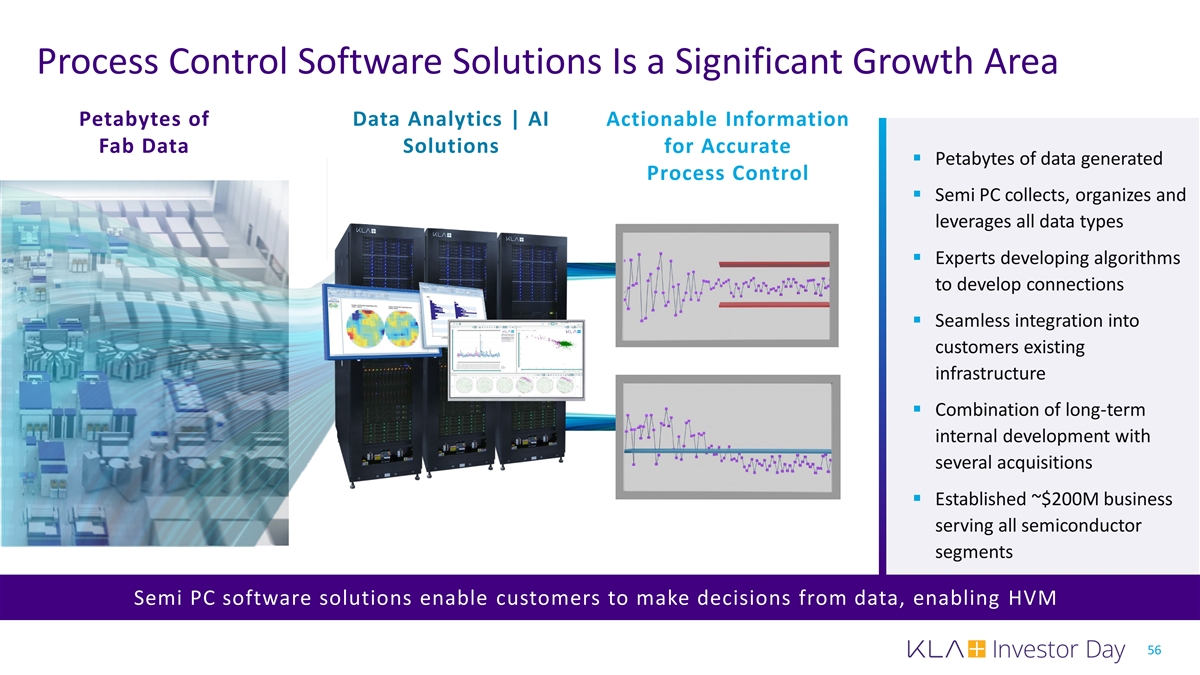
Process Control Software Solutions Is a Significant Growth Area Petabytes of Data Analytics | AI Actionable Information Fab Data Solutions for Accurate § Petabytes of data generated Process Control § Semi PC collects, organizes and leverages all data types § Experts developing algorithms to develop connections § Seamless integration into customers existing infrastructure § Combination of long-term internal development with several acquisitions § Established ~$200M business serving all semiconductor segments Semi PC software solutions enable customers to make decisions from data, enabling HVM 56
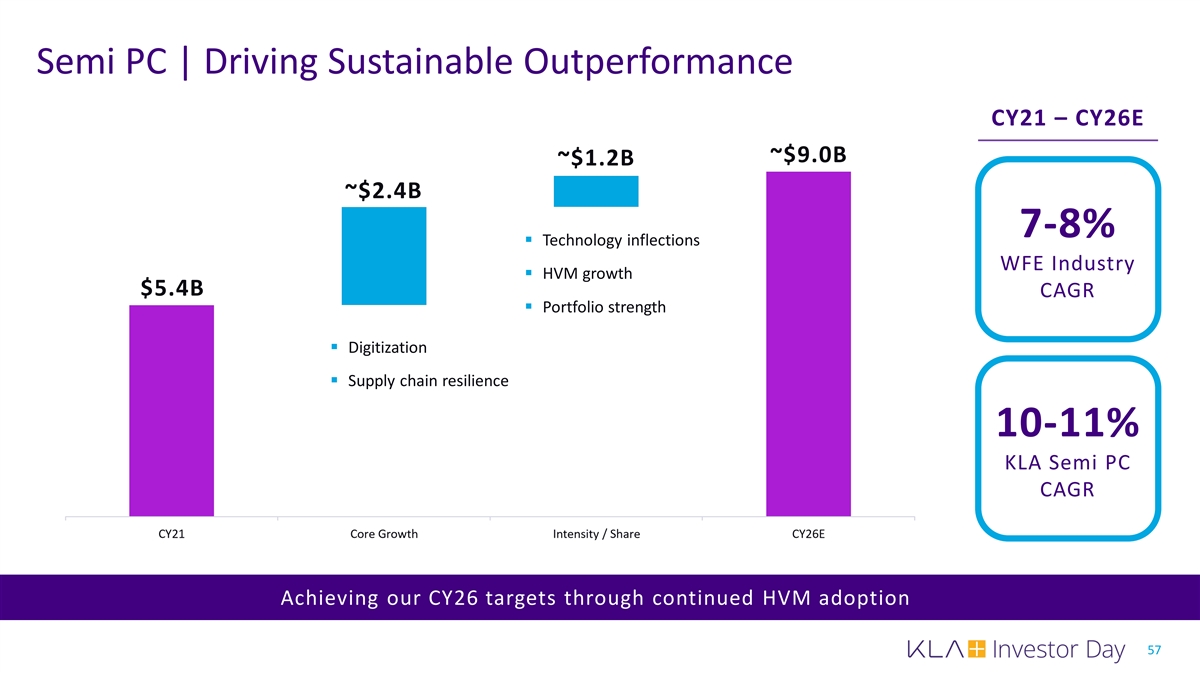
Semi PC | Driving Sustainable Outperformance CY21 – CY26E ~$9.0B ~$1.2B ~$2.4B 7-8% § Technology inflections WFE Industry § HVM growth $5.4B CAGR § Portfolio strength § Digitization § Supply chain resilience 10-11% KLA Semi PC CAGR Achieving our CY26 targets through continued HVM adoption 57
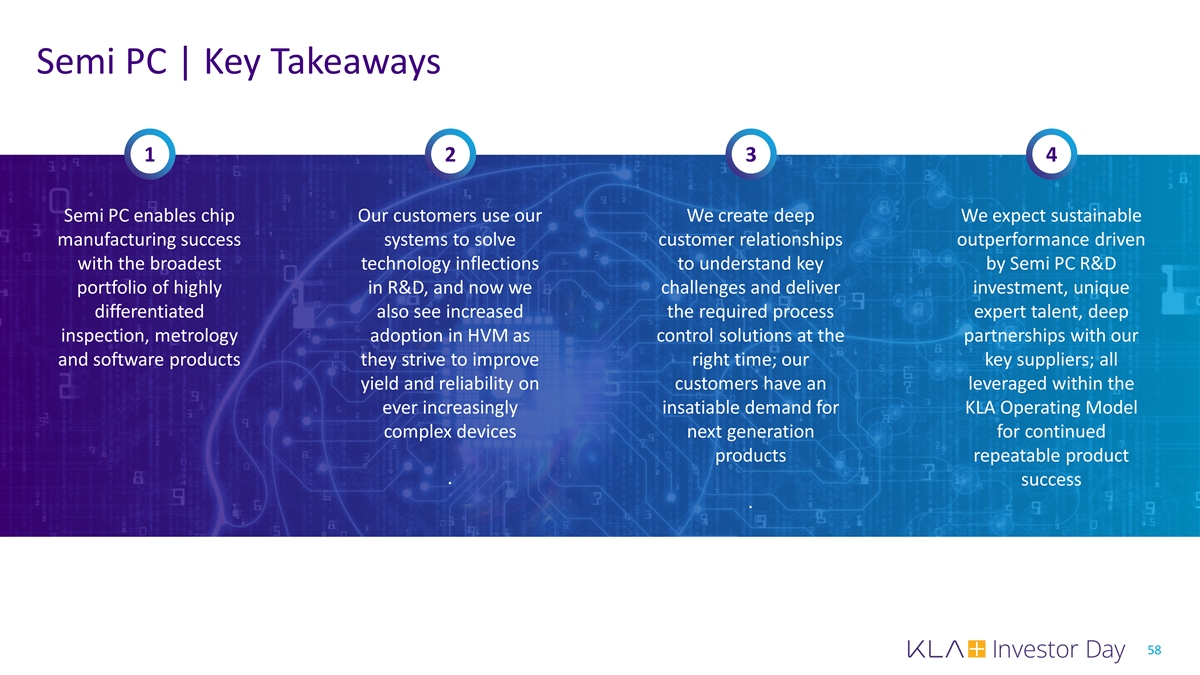
Semi PC | Key Takeaways 1 2 3 4 Semi PC enables chip Our customers use our We create deep We expect sustainable manufacturing success systems to solve customer relationships outperformance driven with the broadest technology inflections to understand key by Semi PC R&D portfolio of highly in R&D, and now we challenges and deliver investment, unique differentiated also see increased the required process expert talent, deep inspection, metrology adoption in HVM as control solutions at the partnerships with our and software products they strive to improve right time; our key suppliers; all yield and reliability on customers have an leveraged within the ever increasingly insatiable demand for KLA Operating Model complex devices next generation for continued products repeatable product . success . 58
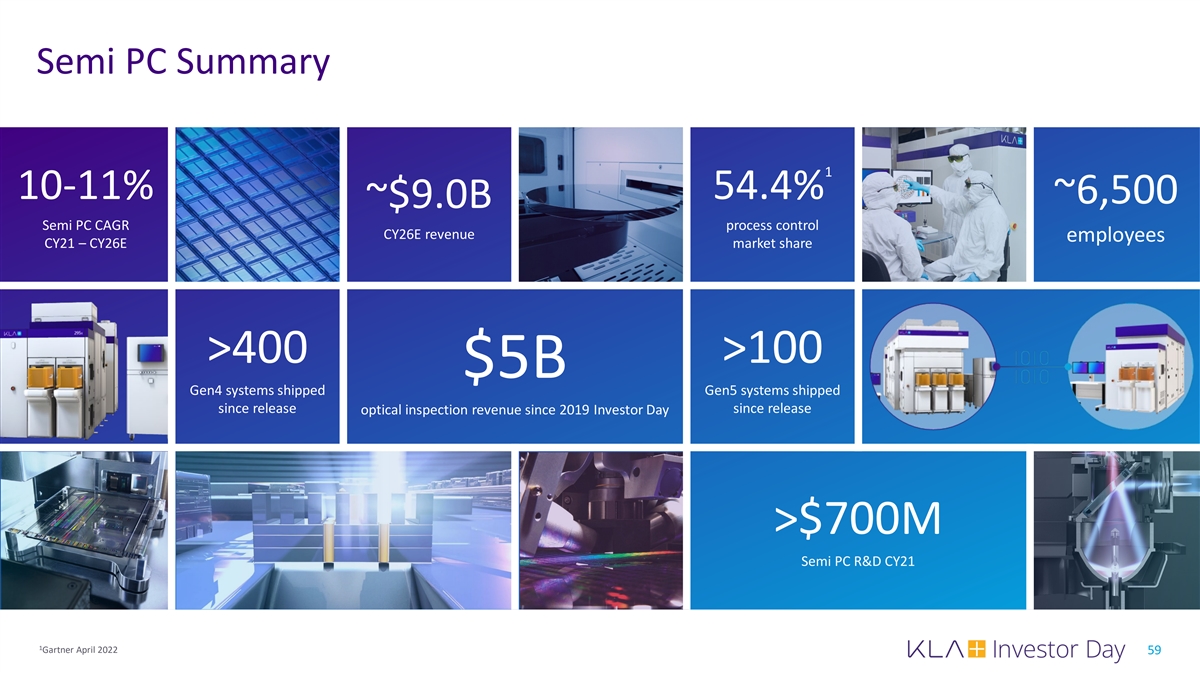
Semi PC Summary 1 10-11% 54.4% ~6,500 ~$9.0B Semi PC CAGR process control CY26E revenue employees CY21 – CY26E market share >400 >100 $5B Gen4 systems shipped Gen5 systems shipped since release since release optical inspection revenue since 2019 Investor Day >$700M Semi PC R&D CY21 1 Gartner April 2022 59
EPC Business Expansion Oreste Donzella EVP, Electronics, Packaging and Components
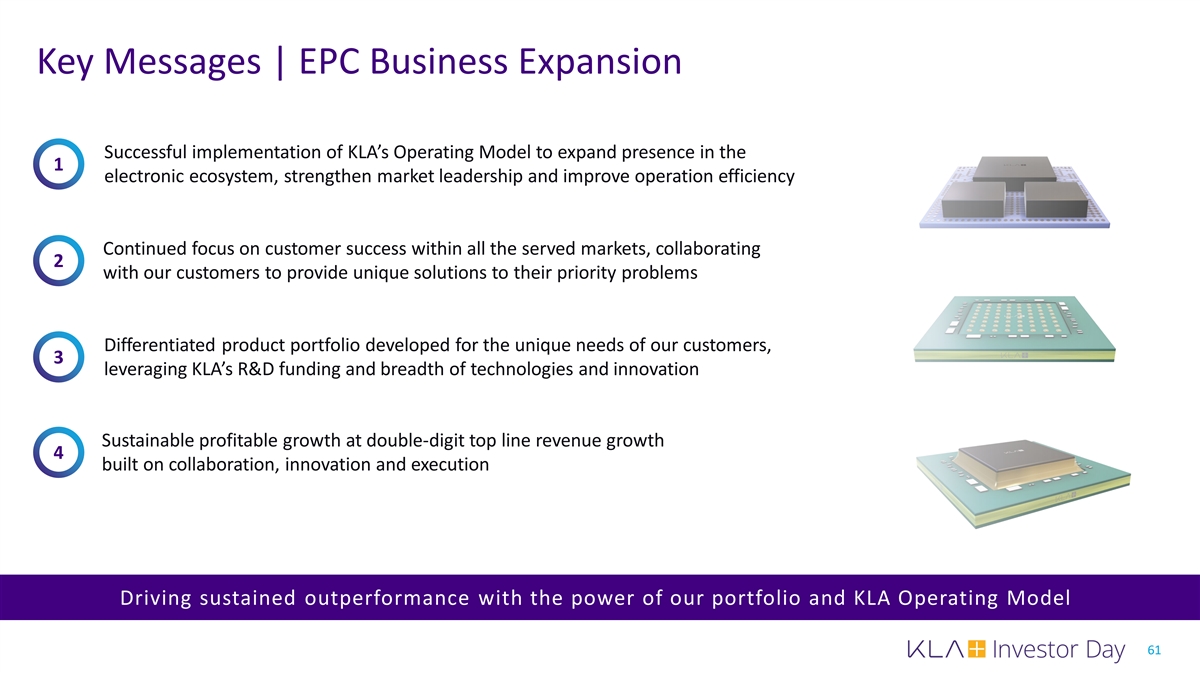
Key Messages | EPC Business Expansion Successful implementation of KLA’s Operating Model to expand presence in the 1 electronic ecosystem, strengthen market leadership and improve operation efficiency Continued focus on customer success within all the served markets, collaborating 2 with our customers to provide unique solutions to their priority problems Differentiated product portfolio developed for the unique needs of our customers, 3 leveraging KLA’s R&D funding and breadth of technologies and innovation Sustainable profitable growth at double-digit top line revenue growth 4 built on collaboration, innovation and execution Driving sustained outperformance with the power of our portfolio and KLA Operating Model 61

EPC Represents an Attractive Growth Vector for KLA ~15% EPC Systems Revenue CAGR 6,000-10,000 semiconductors per vehicle 1 CY19 CY20 CY21 CY22E Automotive: zero defect, new materials ~40% EPC Operating Income CAGR 1 Advanced packaging: CY19 CY20 CY21 CY22E semiconductor roadmap enabler Demonstrated the power of the KLA Operating Model while capitalizing on key industry inflections 1 Pro Forma 62 $M $M
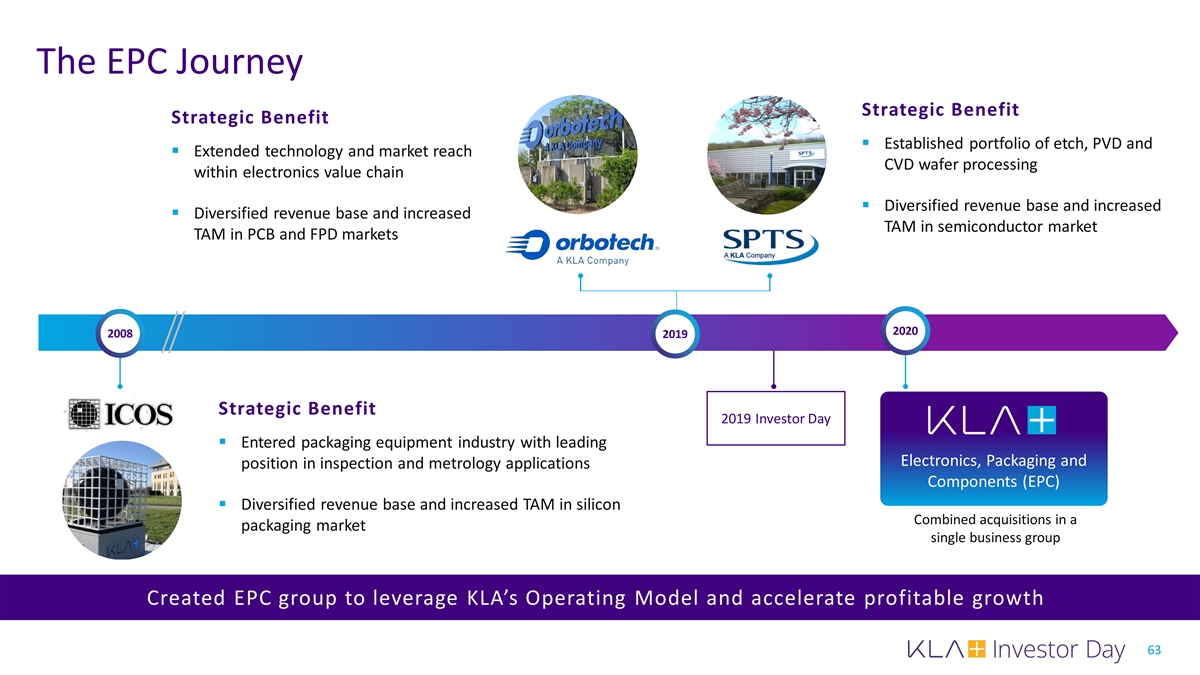
The EPC Journey Strategic Benefit Strategic Benefit § Established portfolio of etch, PVD and § Extended technology and market reach CVD wafer processing within electronics value chain § Diversified revenue base and increased § Diversified revenue base and increased TAM in semiconductor market TAM in PCB and FPD markets 2020 2008 2019 Strategic Benefit 2019 Investor Day § Entered packaging equipment industry with leading Electronics, Packaging and position in inspection and metrology applications Components (EPC) § Diversified revenue base and increased TAM in silicon Combined acquisitions in a packaging market single business group Created EPC group to leverage KLA’s Operating Model and accelerate profitable growth 63
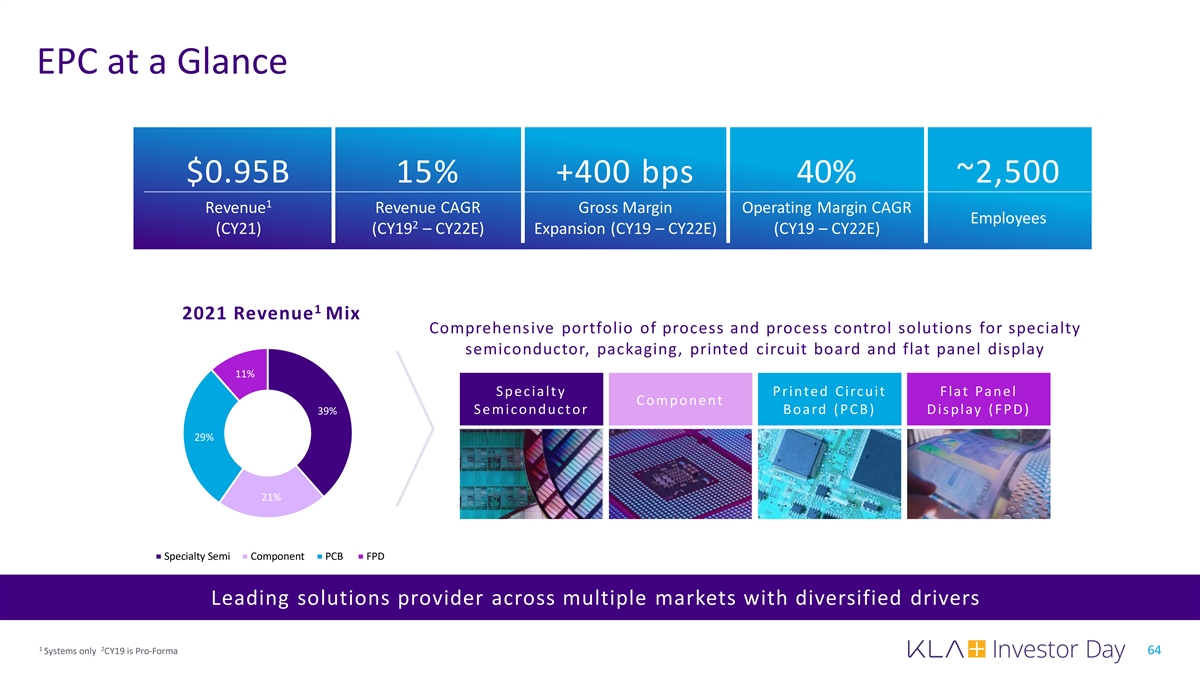
EPC at a Glance $0.95B 15% +400 bps 40% ~2,500 1 Revenue Revenue CAGR Gross Margin Operating Margin CAGR Employees 2 (CY21) (CY19 – CY22E) Expansion (CY19 – CY22E) (CY19 – CY22E) 1 2021 Revenue Mix Comprehensive portfolio of process and process control solutions for specialty semiconductor, packaging, printed circuit board and flat panel display 11% S p e c ia lt y Printed Circuit Flat Panel C o m pone nt S e m ic o nduc t o r Board (PCB) Display (FPD) 39% 29% 21% Specialty Semi Component PCB FPD Leading solutions provider across multiple markets with diversified drivers 1 2 Systems only CY19 is Pro-Forma 64
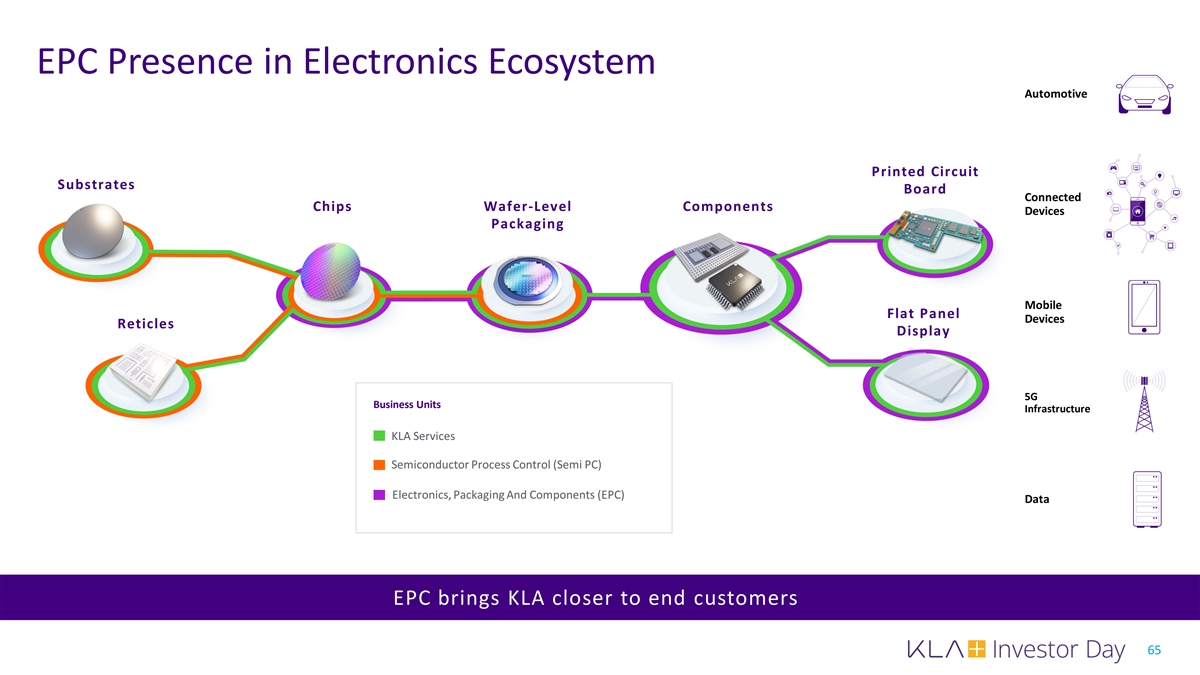
EPC Presence in Electronics Ecosystem Automotive Printed Circuit Substrates Board Connected Chips Wafer-Level Components Devices Packaging Mobile Flat Panel Devices Reticles Display 5G Business Units Infrastructure KLA Services Semiconductor Process Control (Semi PC) Electronics, Packaging And Components (EPC) Data EPC brings KLA closer to end customers 65
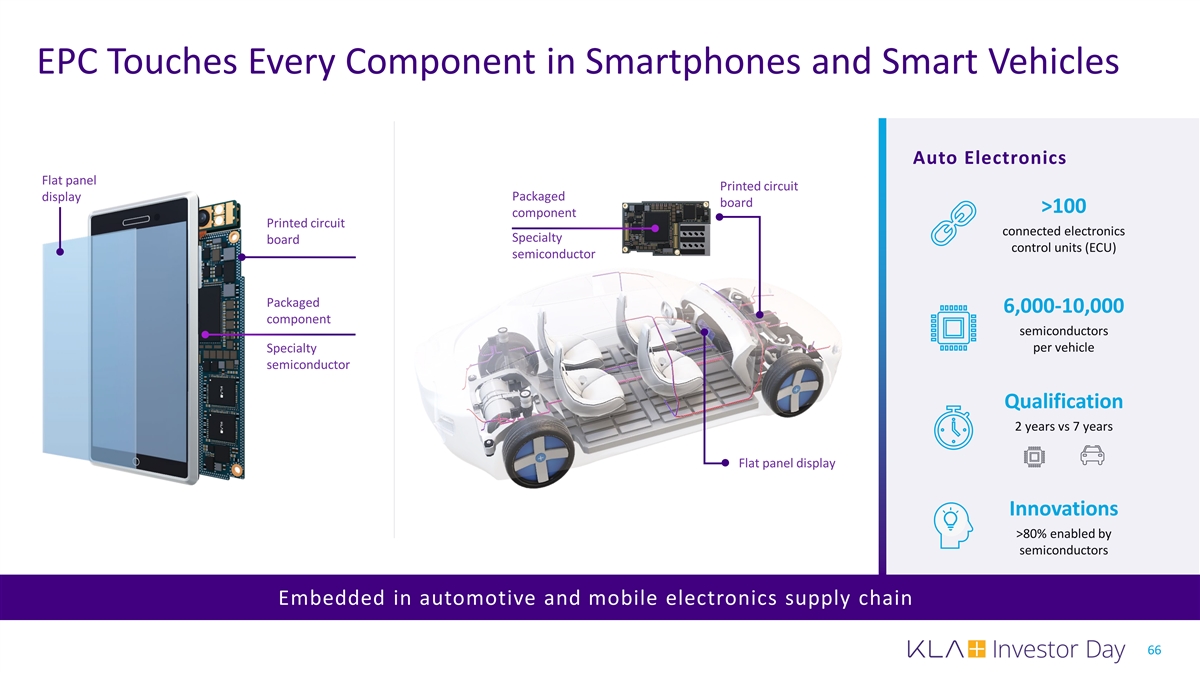
EPC Touches Every Component in Smartphones and Smart Vehicles Auto Electronics Flat panel Printed circuit display Packaged board >100 component Printed circuit connected electronics Specialty board control units (ECU) semiconductor Packaged 6,000-10,000 component semiconductors Specialty per vehicle semiconductor Qualification 2 years vs 7 years Flat panel display Innovations >80% enabled by semiconductors Embedded in automotive and mobile electronics supply chain 66
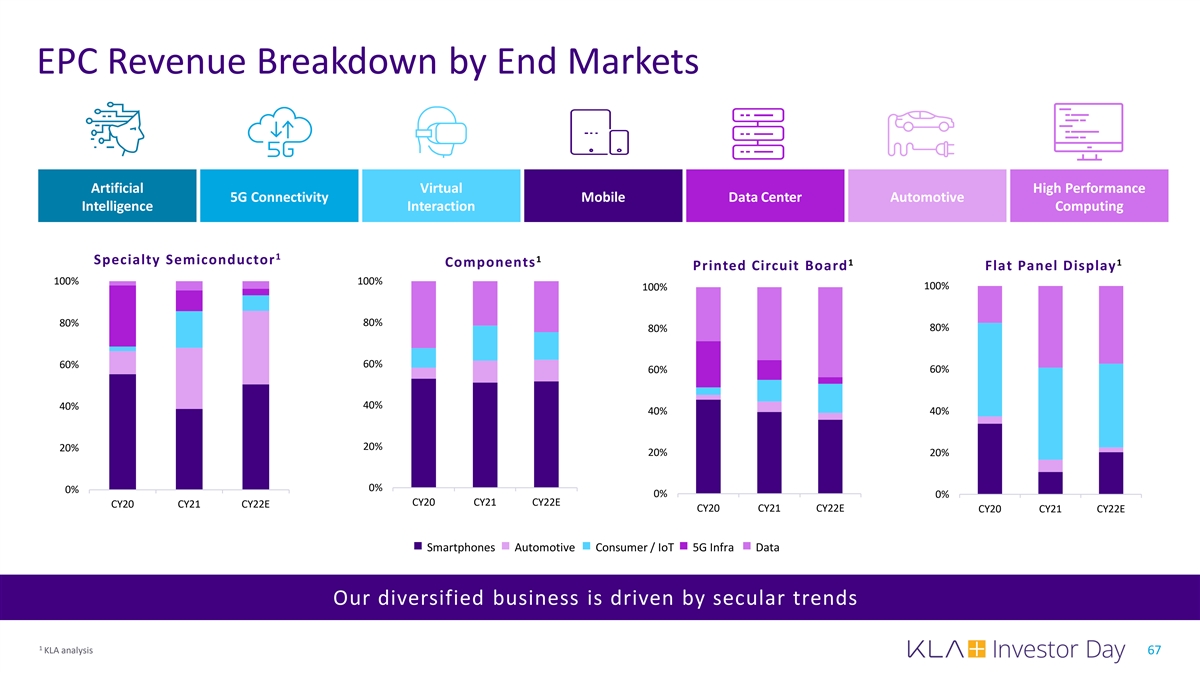
EPC Revenue Breakdown by End Markets Artificial Virtual High Performance 5G Connectivity Mobile Data Center Automotive Intelligence Interaction Computing 1 1 Specialty Semiconductor 1 1 Components Printed Circuit Board Flat Panel Display 100% 100% 100% 100% 80% 80% 80% 80% 60% 60% 60% 60% 40% 40% 40% 40% 20% 20% 20% 20% 0% 0% 0% 0% CY20 CY21 CY22E CY20 CY21 CY22E CY20 CY21 CY22E CY20 CY21 CY22E Smartphones Automotive Consumer / IoT 5G Infra Data Our diversified business is driven by secular trends 1 KLA analysis 67
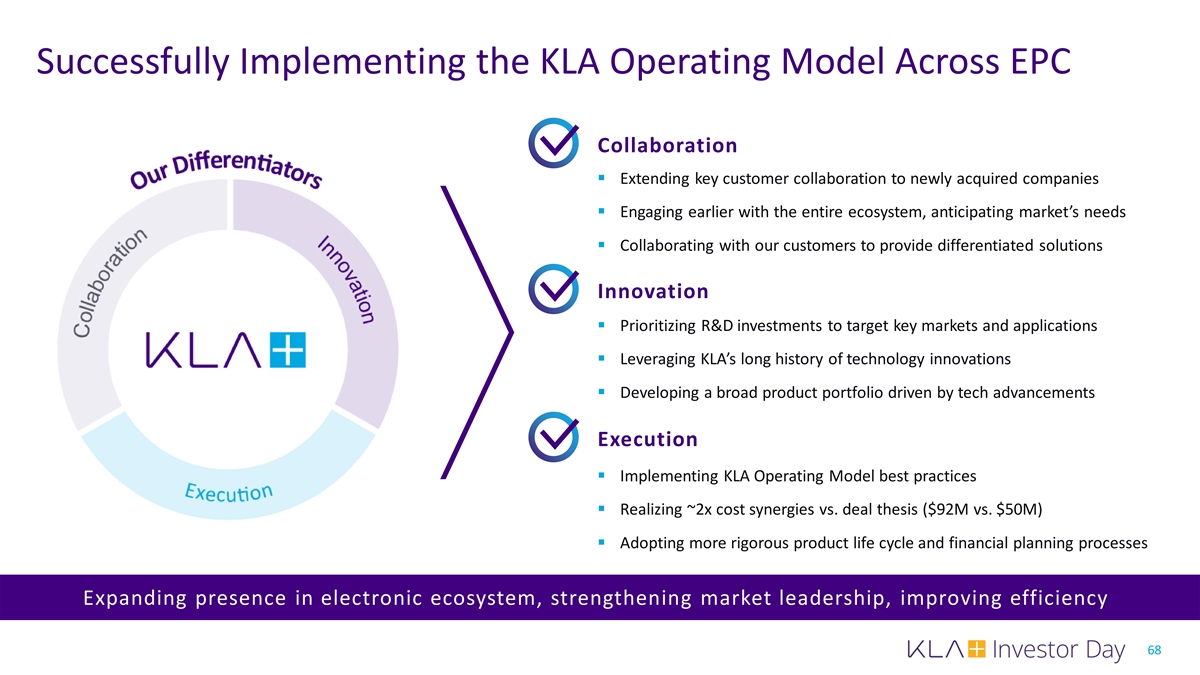
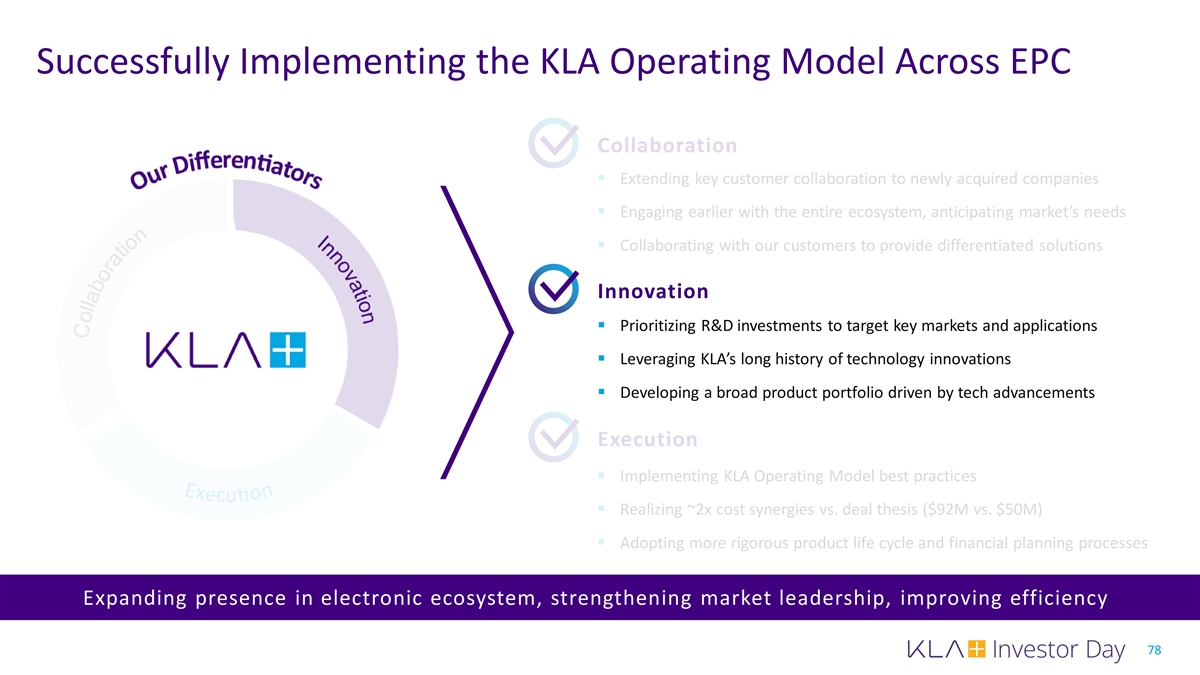
Successfully Implementing the KLA Operating Model Across EPC Collaboration § Extending key customer collaboration to newly acquired companies § Engaging earlier with the entire ecosystem, anticipating market’s needs § Collaborating with our customers to provide differentiated solutions Innovation § Prioritizing R&D investments to target key markets and applications § Leveraging KLA’s long history of technology innovations § Developing a broad product portfolio driven by tech advancements Execution § Implementing KLA Operating Model best practices § Realizing ~2x cost synergies vs. deal thesis ($92M vs. $50M) § Adopting more rigorous product life cycle and financial planning processes Expanding presence in electronic ecosystem, strengthening market leadership, improving efficiency 68
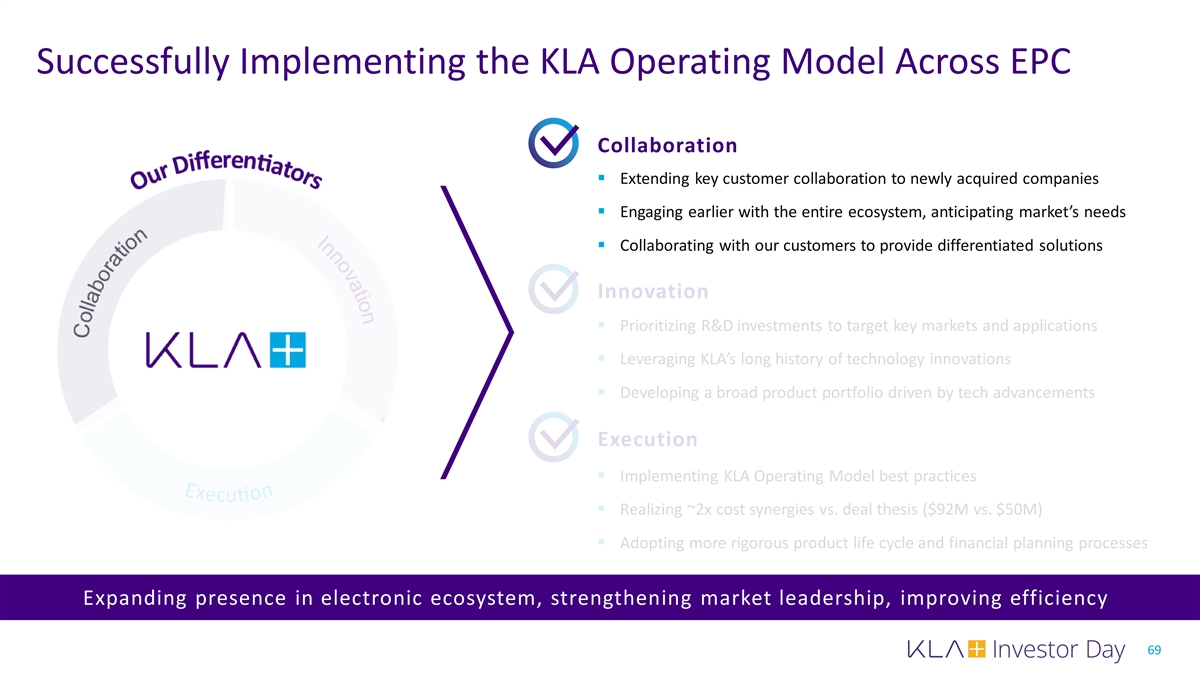
Successfully Implementing the KLA Operating Model Across EPC Collaboration § Extending key customer collaboration to newly acquired companies § Engaging earlier with the entire ecosystem, anticipating market’s needs § Collaborating with our customers to provide differentiated solutions Innovation § Prioritizing R&D investments to target key markets and applications § Leveraging KLA’s long history of technology innovations § Developing a broad product portfolio driven by tech advancements Execution § Implementing KLA Operating Model best practices § Realizing ~2x cost synergies vs. deal thesis ($92M vs. $50M) § Adopting more rigorous product life cycle and financial planning processes Expanding presence in electronic ecosystem, strengthening market leadership, improving efficiency 69
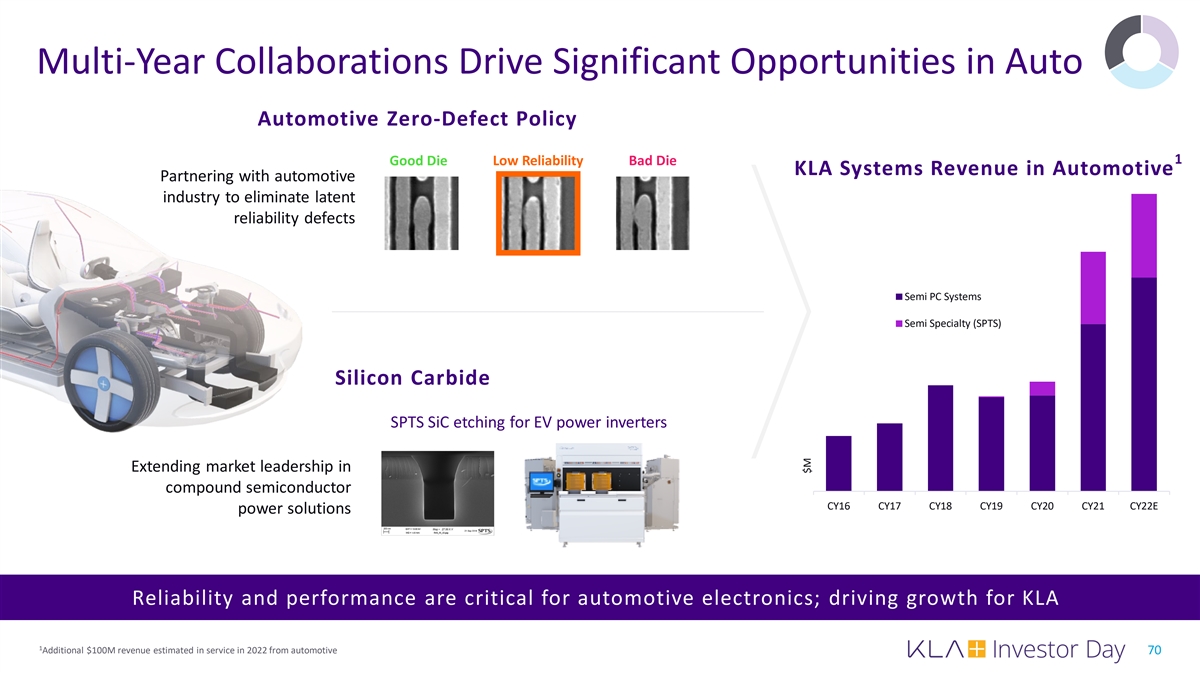
Multi-Year Collaborations Drive Significant Opportunities in Auto Automotive Zero-Defect Policy 1 Good Die Low Reliability Bad Die KLA Systems Revenue in Automotive Partnering with automotive industry to eliminate latent reliability defects Semi PC Systems Semi Specialty (SPTS) Silicon Carbide SPTS SiC etching for EV power inverters Extending market leadership in compound semiconductor CY16 CY17 CY18 CY19 CY20 CY21 CY22E power solutions Reliability and performance are critical for automotive electronics; driving growth for KLA 1 Additional $100M revenue estimated in service in 2022 from automotive 70 $M
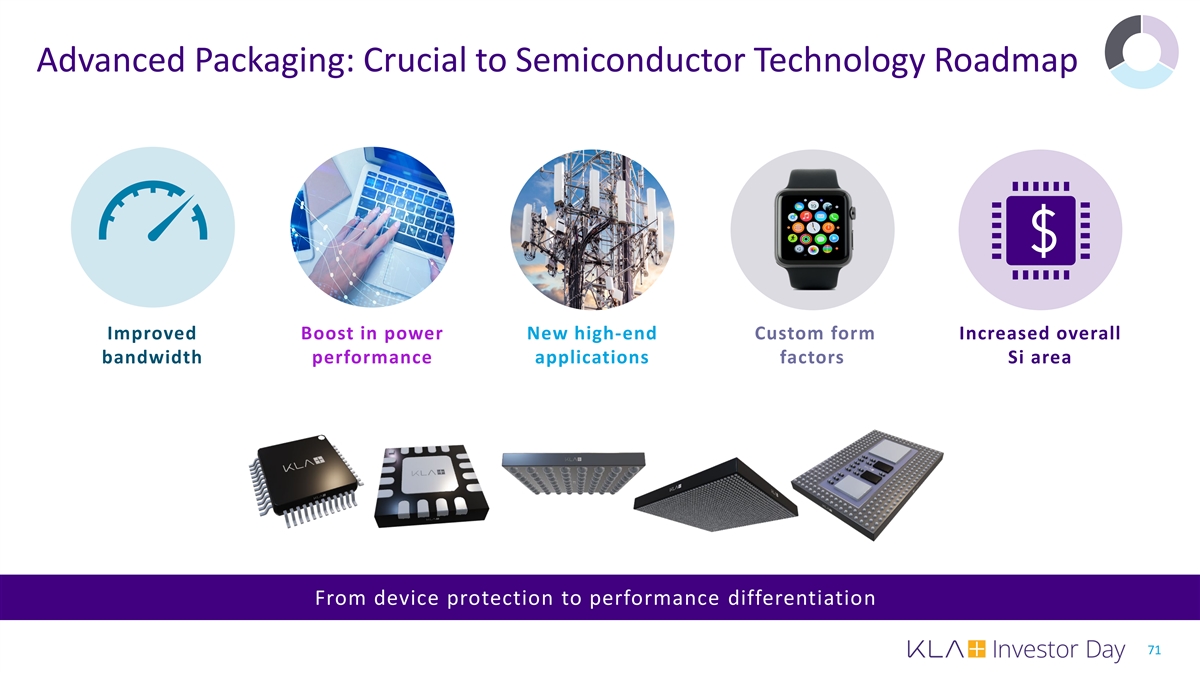
Advanced Packaging: Crucial to Semiconductor Technology Roadmap Improved Boost in power New high-end Custom form Increased overall bandwidth performance applications factors Si area From device protection to performance differentiation 71
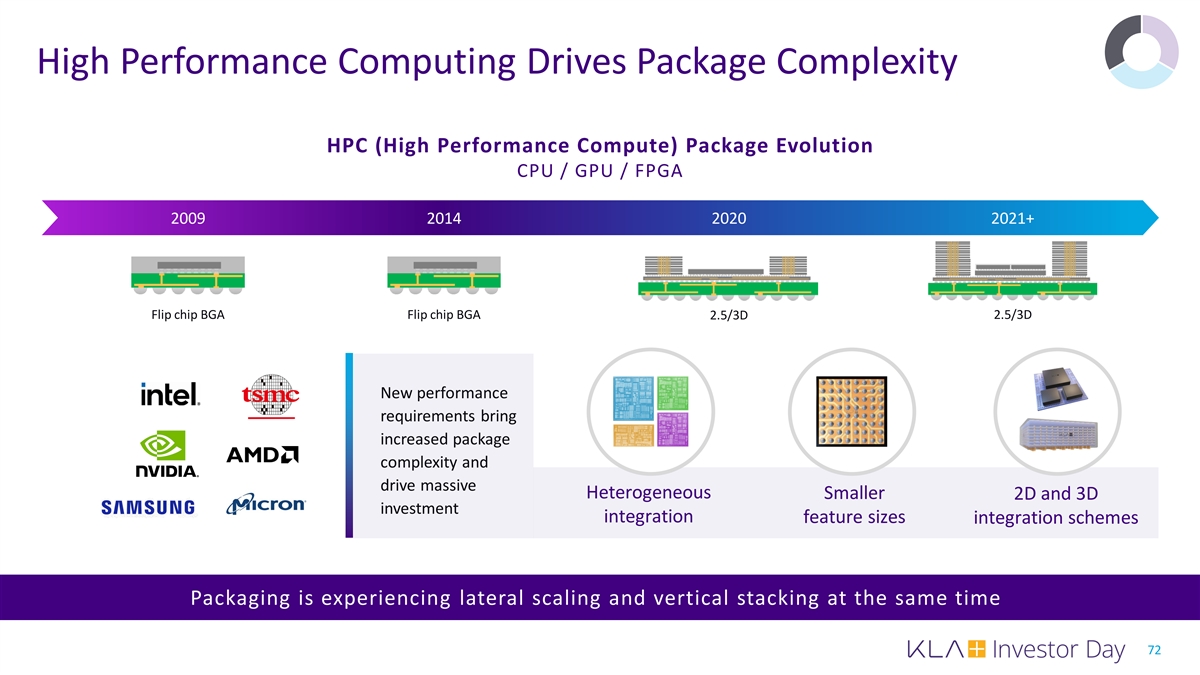
High Performance Computing Drives Package Complexity HPC (High Performance Compute) Package Evolution CPU / GPU / FPGA 2009 2014 2020 2021+ Flip chip BGA Flip chip BGA 2.5/3D 2.5/3D New performance requirements bring increased package complexity and drive massive Heterogeneous Smaller 2D and 3D investment integration feature sizes integration schemes Packaging is experiencing lateral scaling and vertical stacking at the same time 72
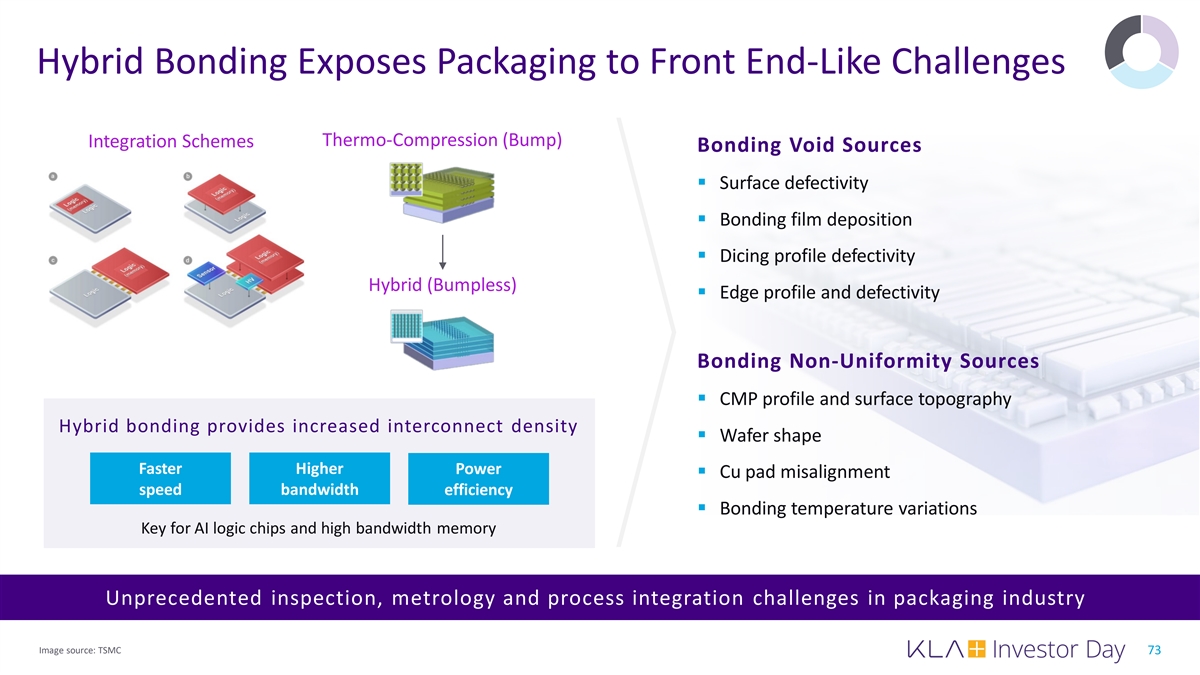
Hybrid Bonding Exposes Packaging to Front End-Like Challenges Thermo-Compression (Bump) Integration Schemes Bonding Void Sources § Surface defectivity § Bonding film deposition § Dicing profile defectivity Hybrid (Bumpless) § Edge profile and defectivity Bonding Non-Uniformity Sources § CMP profile and surface topography Hybrid bonding provides increased interconnect density § Wafer shape Faster Higher Power § Cu pad misalignment speed bandwidth efficiency § Bonding temperature variations Key for AI logic chips and high bandwidth memory Unprecedented inspection, metrology and process integration challenges in packaging industry Image source: TSMC 73
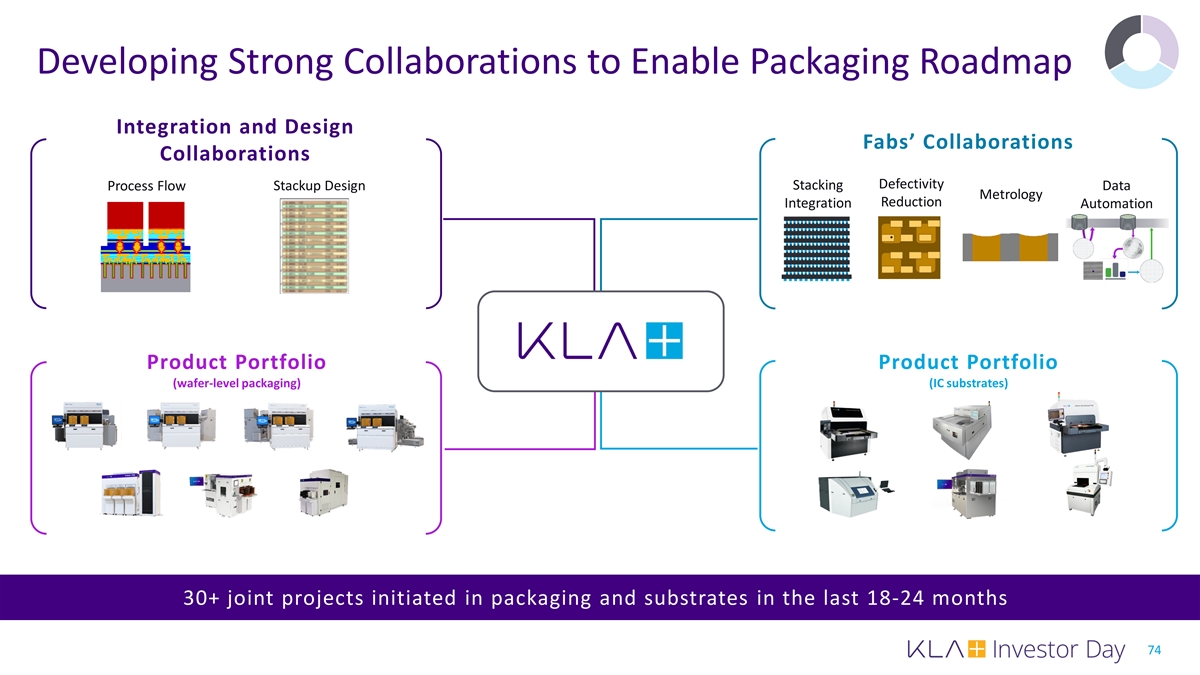
Developing Strong Collaborations to Enable Packaging Roadmap Integration and Design Fabs’ Collaborations Collaborations Defectivity Stackup Design Stacking Data Process Flow Metrology Reduction Integration Automation Product Portfolio Product Portfolio (wafer-level packaging) (IC substrates) 30+ joint projects initiated in packaging and substrates in the last 18-24 months 74
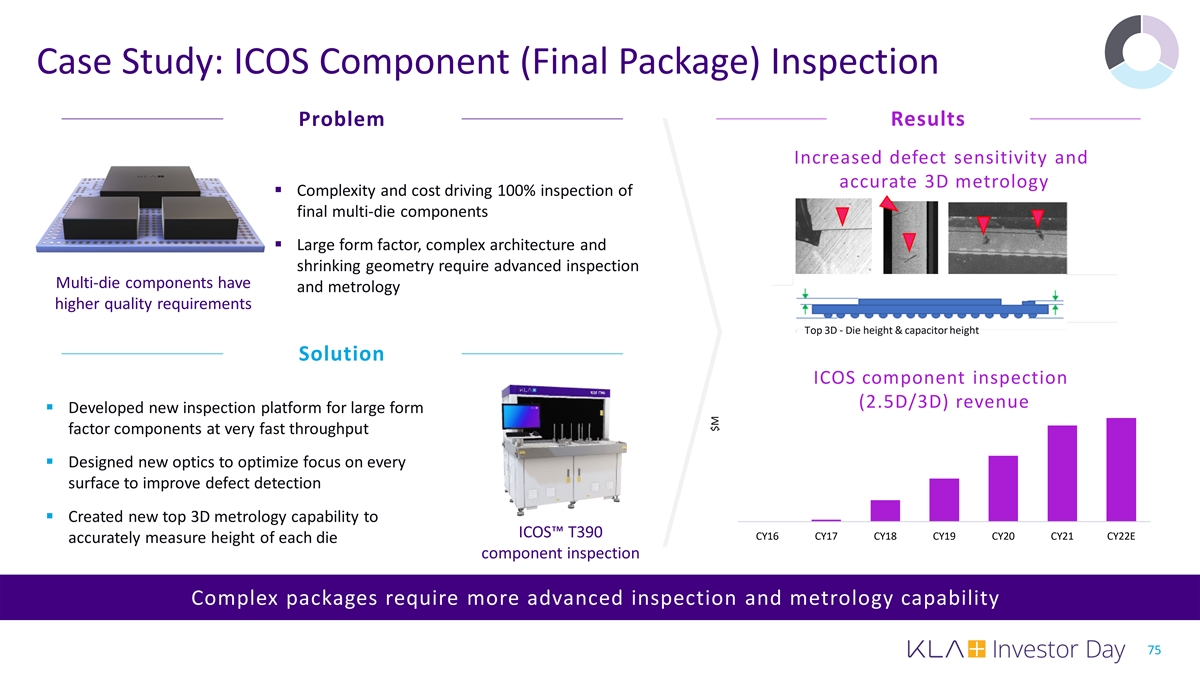
Case Study: ICOS Component (Final Package) Inspection Problem Results Increased defect sensitivity and accurate 3D metrology § Complexity and cost driving 100% inspection of final multi-die components § Large form factor, complex architecture and shrinking geometry require advanced inspection Multi-die components have and metrology higher quality requirements Top 3D - Die height & capacitor height Solution ICOS component inspection (2.5D/3D) revenue § Developed new inspection platform for large form factor components at very fast throughput § Designed new optics to optimize focus on every surface to improve defect detection § Created new top 3D metrology capability to ICOS™ T390 CY16 CY17 CY18 CY19 CY20 CY21 CY22E accurately measure height of each die component inspection Complex packages require more advanced inspection and metrology capability 75 $M
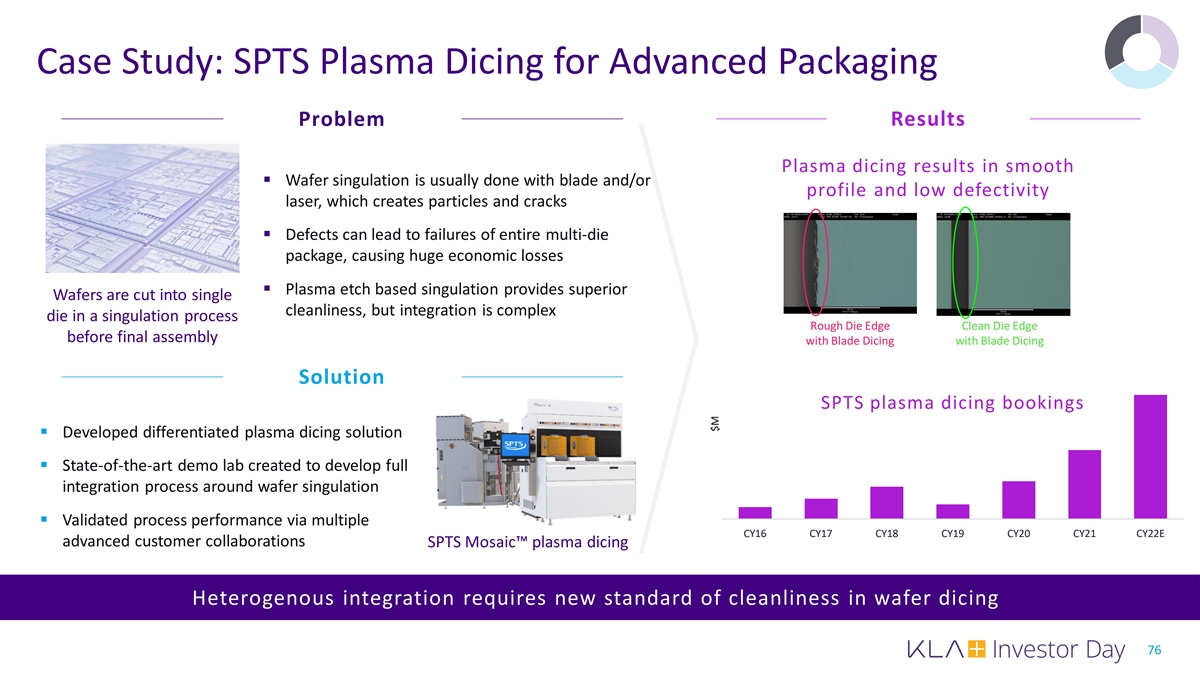
Case Study: SPTS Plasma Dicing for Advanced Packaging Problem Results Plasma dicing results in smooth § Wafer singulation is usually done with blade and/or profile and low defectivity laser, which creates particles and cracks § Defects can lead to failures of entire multi-die package, causing huge economic losses § Plasma etch based singulation provides superior Wafers are cut into single cleanliness, but integration is complex die in a singulation process Rough Die Edge Clean Die Edge before final assembly with Blade Dicing with Blade Dicing Solution SPTS plasma dicing bookings § Developed differentiated plasma dicing solution § State-of-the-art demo lab created to develop full integration process around wafer singulation § Validated process performance via multiple CY16 CY17 CY18 CY19 CY20 CY21 CY22E advanced customer collaborations SPTS Mosaic™ plasma dicing Heterogenous integration requires new standard of cleanliness in wafer dicing 76 $M
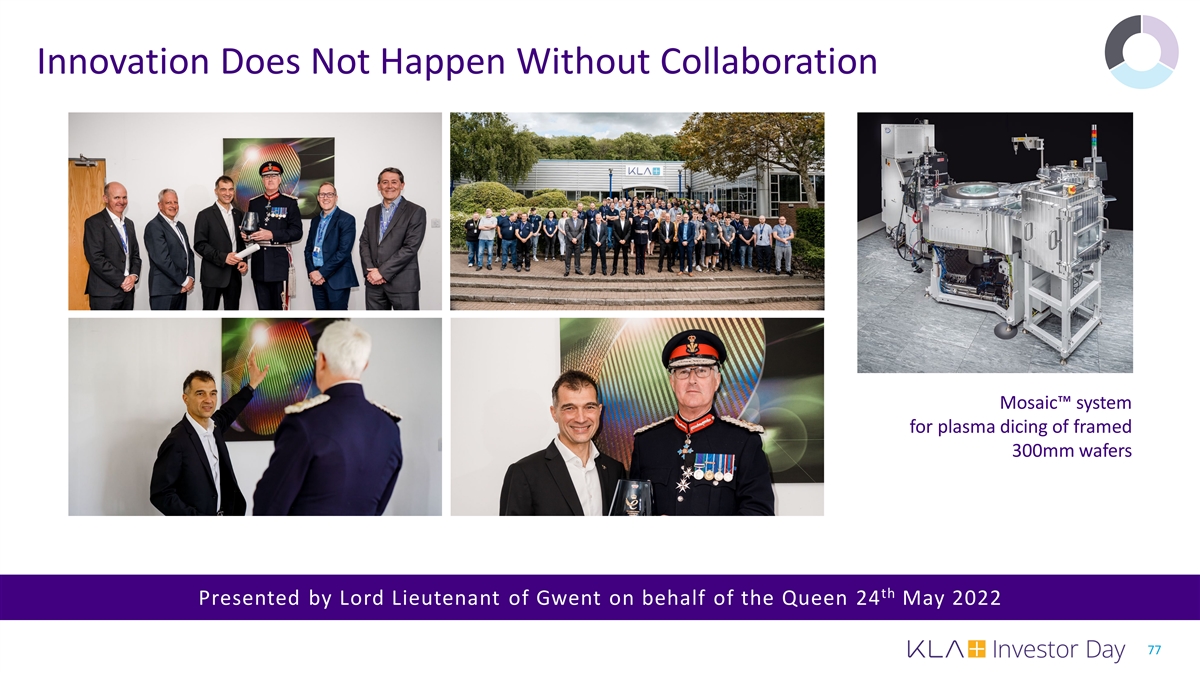
Innovation Does Not Happen Without Collaboration Mosaic™ system for plasma dicing of framed 300mm wafers th Presented by Lord Lieutenant of Gwent on behalf of the Queen 24 May 2022 77
Successfully Implementing the KLA Operating Model Across EPC Collaboration § Extending key customer collaboration to newly acquired companies § Engaging earlier with the entire ecosystem, anticipating market’s needs § Collaborating with our customers to provide differentiated solutions Innovation § Prioritizing R&D investments to target key markets and applications § Leveraging KLA’s long history of technology innovations § Developing a broad product portfolio driven by tech advancements Execution § Implementing KLA Operating Model best practices § Realizing ~2x cost synergies vs. deal thesis ($92M vs. $50M) § Adopting more rigorous product life cycle and financial planning processes Expanding presence in electronic ecosystem, strengthening market leadership, improving efficiency 78
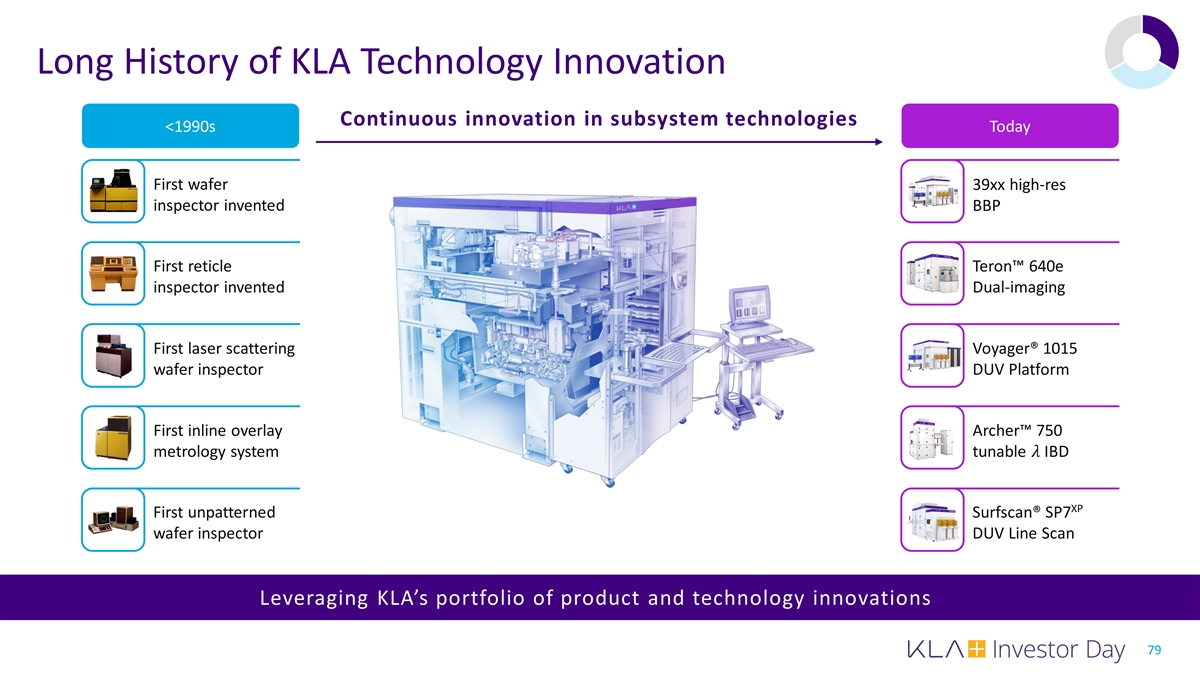
Long History of KLA Technology Innovation Continuous innovation in subsystem technologies <1990s Today First wafer 39xx high-res inspector invented BBP First reticle Teron™ 640e inspector invented Dual-imaging First laser scattering Voyager® 1015 wafer inspector DUV Platform First inline overlay Archer™ 750 metrology system tunable ���� IBD XP First unpatterned Surfscan® SP7 wafer inspector DUV Line Scan Leveraging KLA’s portfolio of product and technology innovations 79
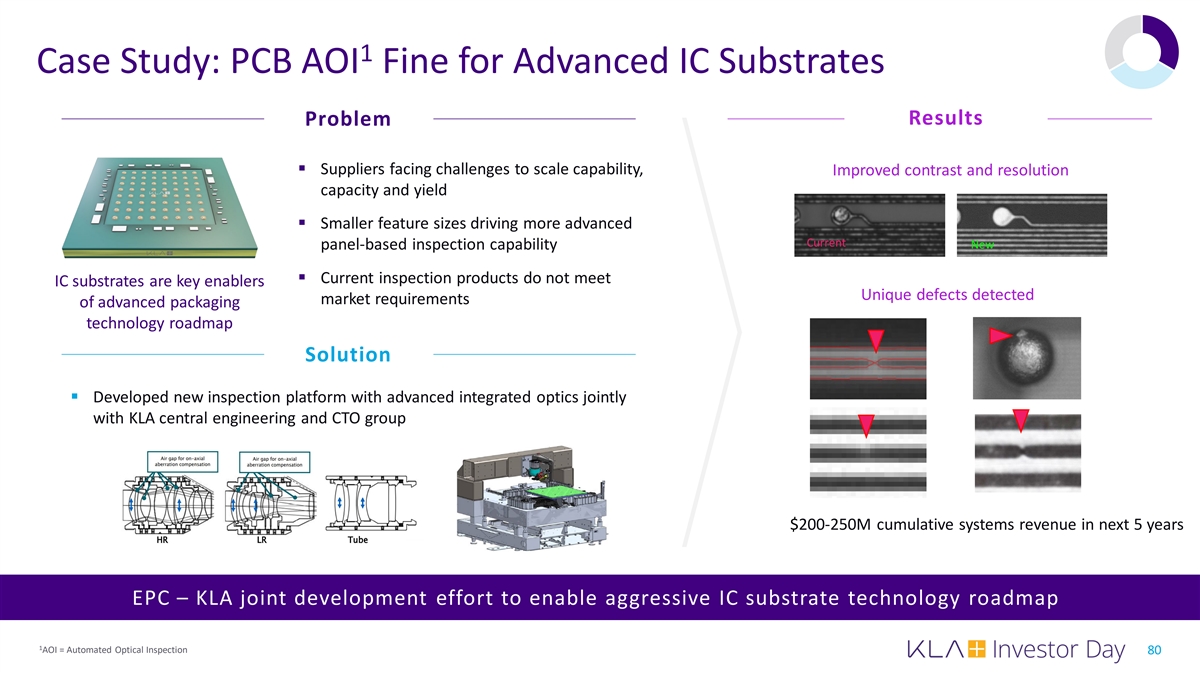
1 Case Study: PCB AOI Fine for Advanced IC Substrates Results Problem § Suppliers facing challenges to scale capability, Improved contrast and resolution capacity and yield § Smaller feature sizes driving more advanced Current New panel-based inspection capability § Current inspection products do not meet IC substrates are key enablers Unique defects detected market requirements of advanced packaging technology roadmap Solution § Developed new inspection platform with advanced integrated optics jointly with KLA central engineering and CTO group $200-250M cumulative systems revenue in next 5 years EPC – KLA joint development effort to enable aggressive IC substrate technology roadmap 1 AOI = Automated Optical Inspection 80
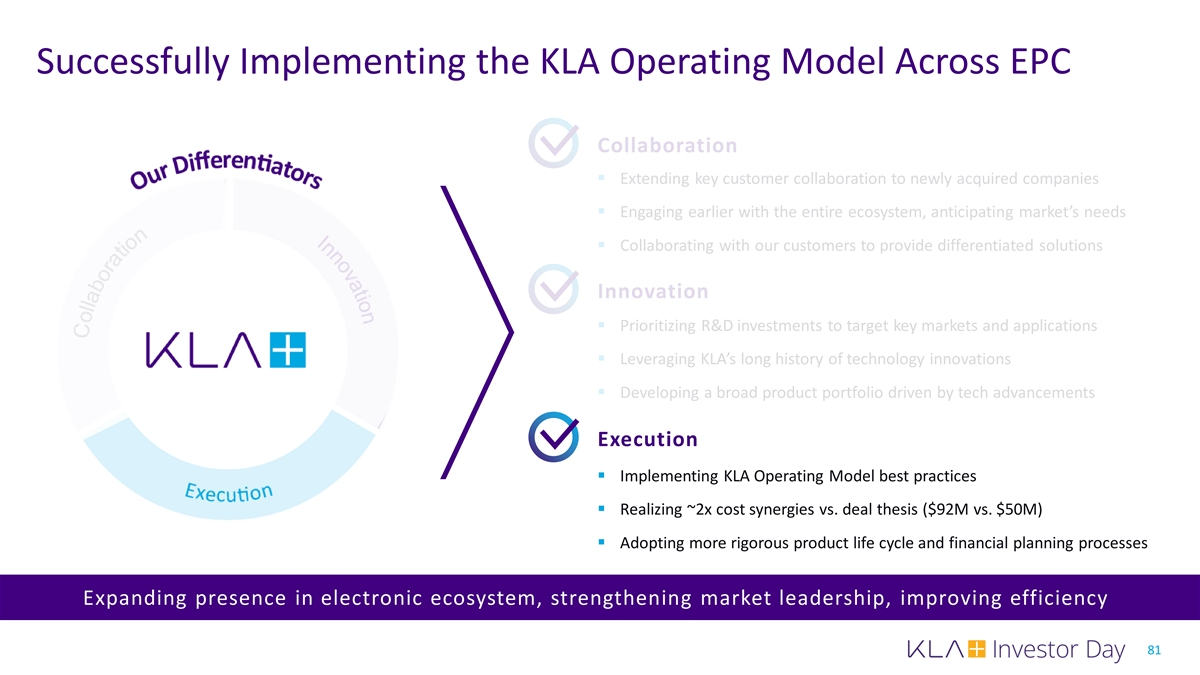
Successfully Implementing the KLA Operating Model Across EPC Collaboration § Extending key customer collaboration to newly acquired companies § Engaging earlier with the entire ecosystem, anticipating market’s needs § Collaborating with our customers to provide differentiated solutions Innovation § Prioritizing R&D investments to target key markets and applications § Leveraging KLA’s long history of technology innovations § Developing a broad product portfolio driven by tech advancements Execution § Implementing KLA Operating Model best practices § Realizing ~2x cost synergies vs. deal thesis ($92M vs. $50M) § Adopting more rigorous product life cycle and financial planning processes Expanding presence in electronic ecosystem, strengthening market leadership, improving efficiency 81
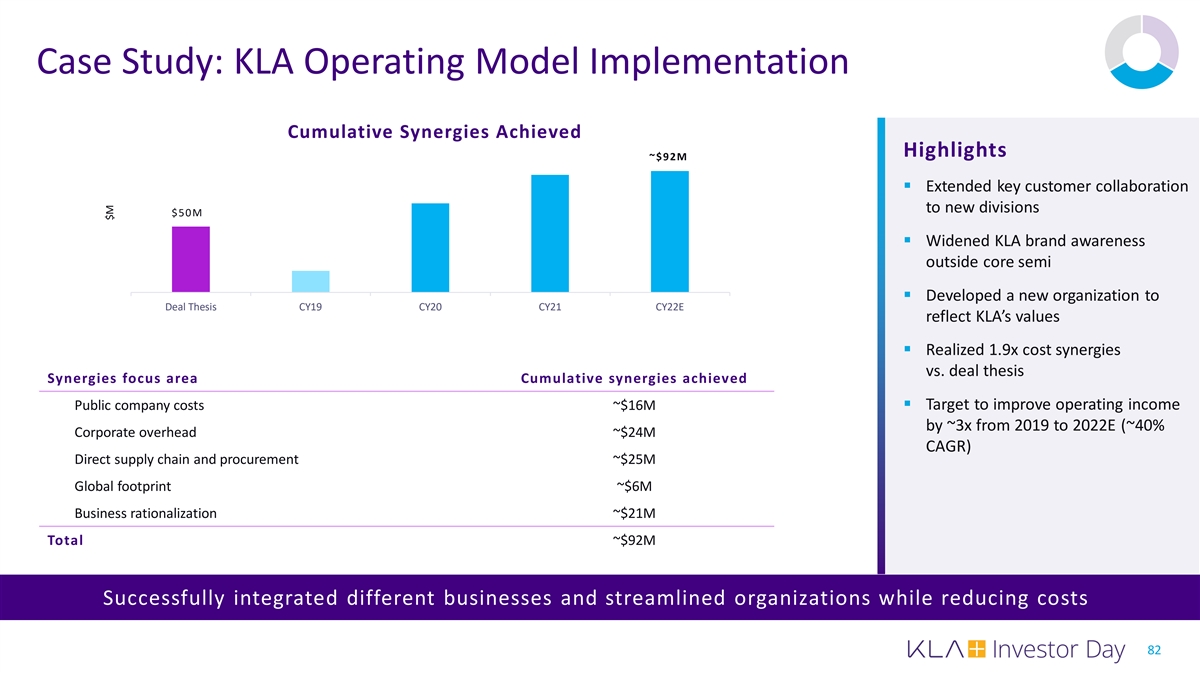
Case Study: KLA Operating Model Implementation Cumulative Synergies Achieved Highlights ~$92M $100 $80§ Extended key customer collaboration to new divisions $50M $60 $40 § Widened KLA brand awareness outside core semi $20 $0 § Developed a new organization to Deal Thesis CY19 CY20 CY21 CY22E reflect KLA’s values § Realized 1.9x cost synergies vs. deal thesis Synergies focus area Cumulative synergies achieved Public company costs ~$16M§ Target to improve operating income by ~3x from 2019 to 2022E (~40% Corporate overhead ~$24M CAGR) Direct supply chain and procurement ~$25M Global footprint ~$6M Business rationalization ~$21M Total ~$92M Successfully integrated different businesses and streamlined organizations while reducing costs 82 $M
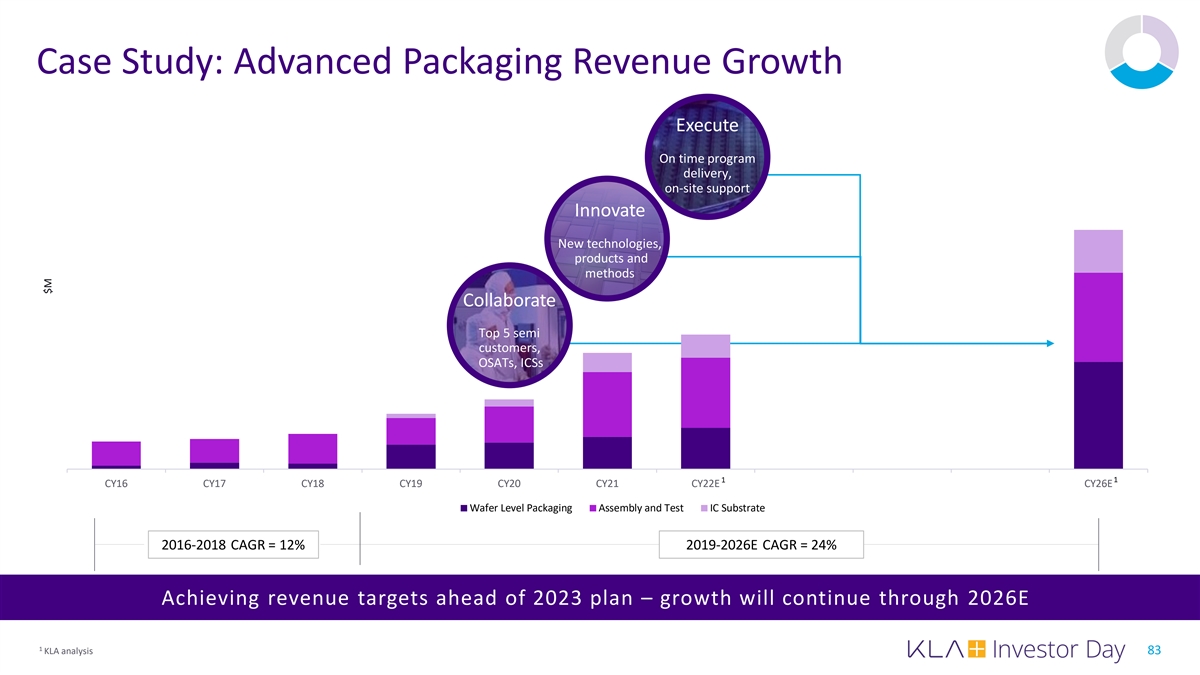
Case Study: Advanced Packaging Revenue Growth Execute On time program delivery, on-site support Innovate New technologies, products and methods Collaborate Top 5 semi customers, OSATs, ICSs 1 1 CY16 CY17 CY18 CY19 CY20 CY21 CY22E 2023 F 2024 F 2025 F CY26E …... Wafer Level Packaging Assembly and Test IC Substrate 2016-2018 CAGR = 12% 2019-2026E CAGR = 24% Achieving revenue targets ahead of 2023 plan – growth will continue through 2026E 1 KLA analysis 83 $M
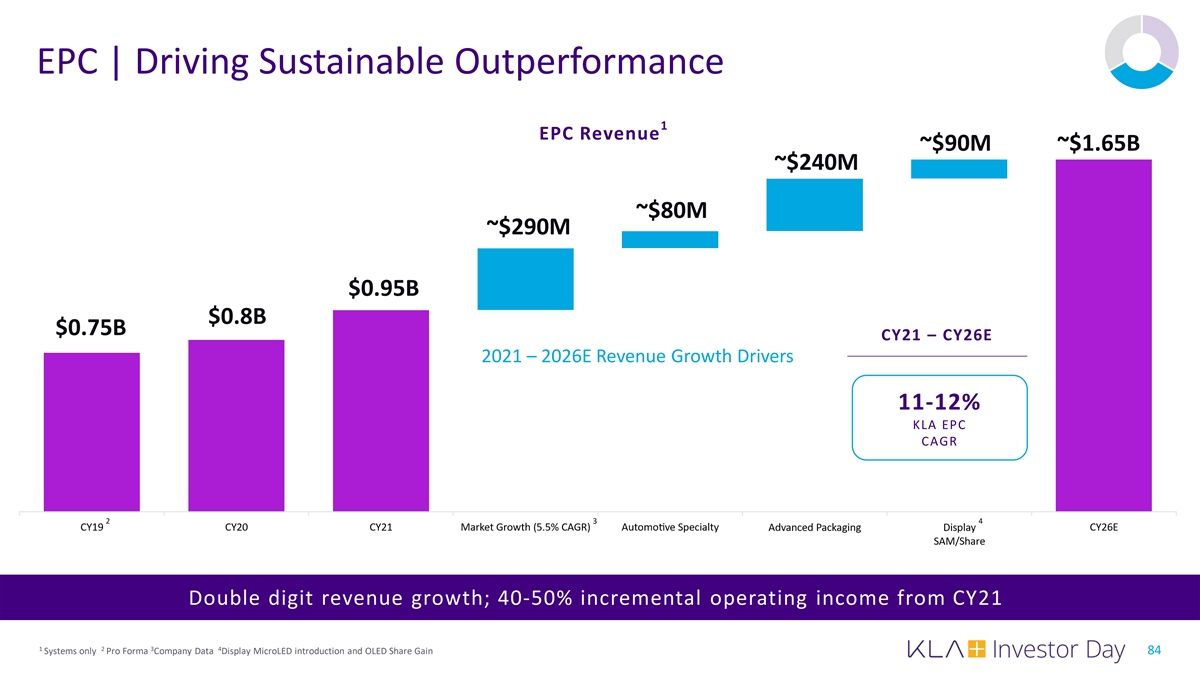
EPC | Driving Sustainable Outperformance 1 EPC Revenue ~$90M ~$1.65B ~$240M ~$80M ~$290M $0.95B $0.8B $0.75B CY21 – CY26E 2021 – 2026E Revenue Growth Drivers 11-12% KLA EPC CAGR 2 3 4 Double digit revenue growth; 40-50% incremental operating income from CY21 1 2 3 4 Systems only Pro Forma Company Data Display MicroLED introduction and OLED Share Gain 84
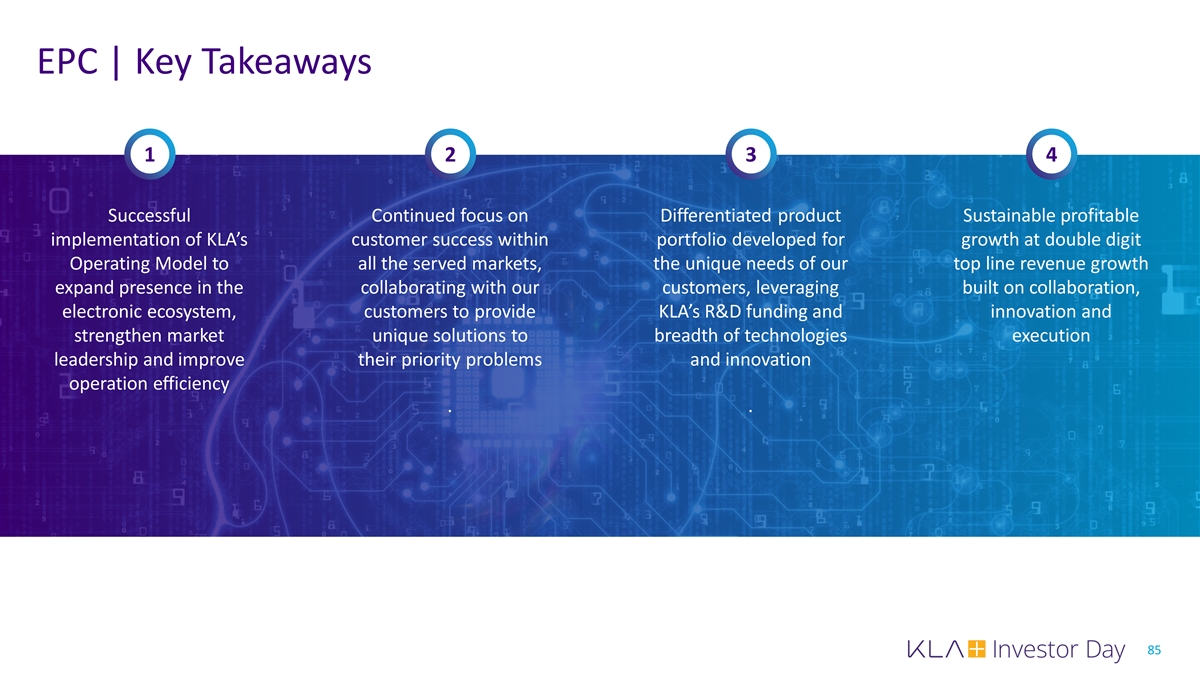
EPC | Key Takeaways 1 2 3 4 Successful Continued focus on Differentiated product Sustainable profitable implementation of KLA’s customer success within portfolio developed for growth at double digit Operating Model to all the served markets, the unique needs of our top line revenue growth expand presence in the collaborating with our customers, leveraging built on collaboration, electronic ecosystem, customers to provide KLA’s R&D funding and innovation and strengthen market unique solutions to breadth of technologies execution leadership and improve their priority problems and innovation operation efficiency . . 85
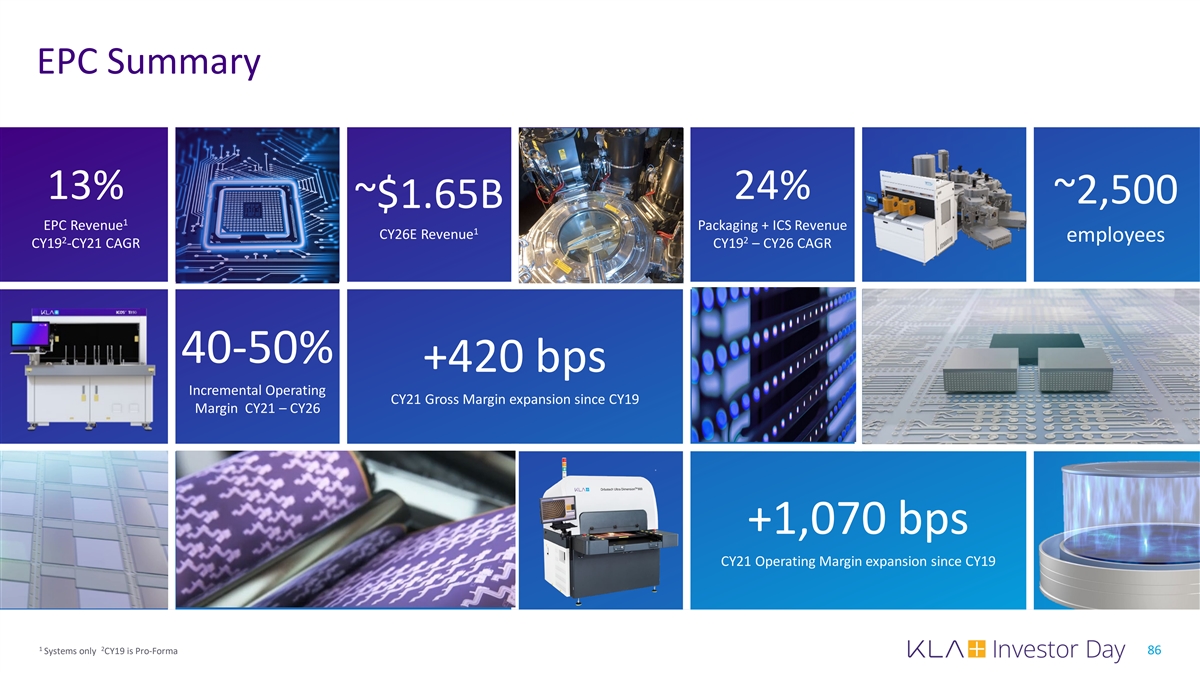
EPC Summary 13% 24% ~2,500 ~$1.65B 1 EPC Revenue Packaging + ICS Revenue 1 CY26E Revenue employees 2 2 CY19 -CY21 CAGR CY19 – CY26 CAGR 40-50% +420 bps Incremental Operating CY21 Gross Margin expansion since CY19 Margin CY21 – CY26 +1,070 bps CY21 Operating Margin expansion since CY19 1 2 Systems only CY19 is Pro-Forma 86
Growing a Durable Revenue Stream Through Best-in-Class Services Business Brian Lorig EVP, Global Services
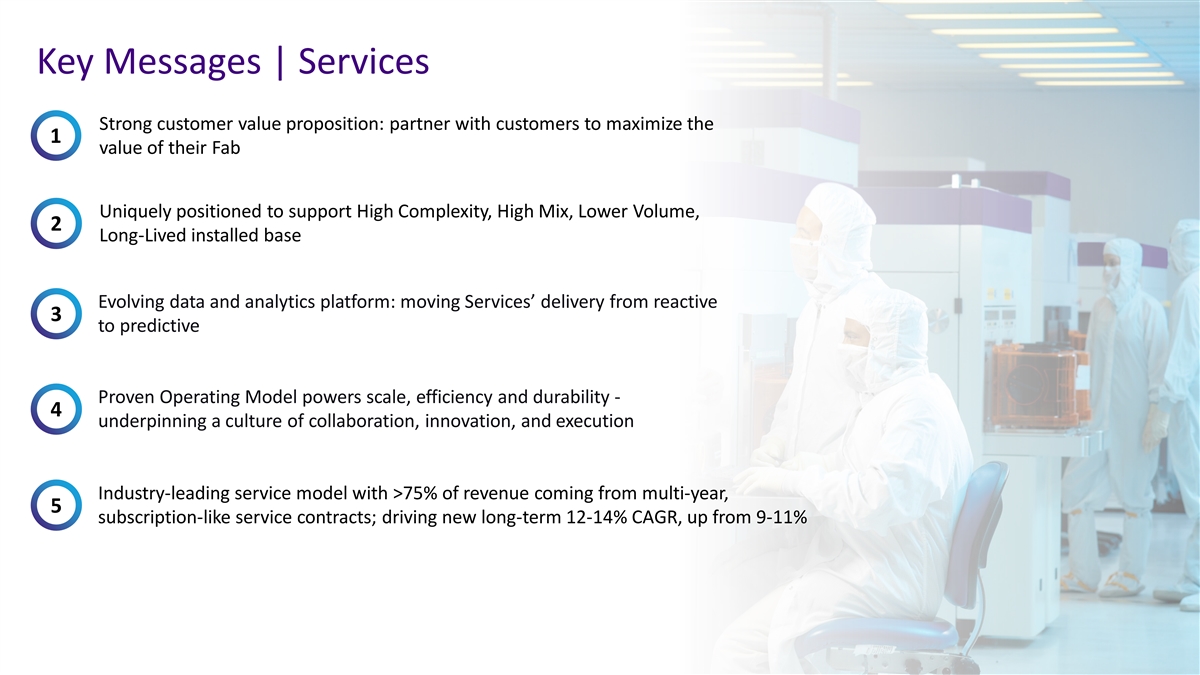
Key Messages | Services Strong customer value proposition: partner with customers to maximize the 1 value of their Fab Uniquely positioned to support High Complexity, High Mix, Lower Volume, 2 Long-Lived installed base Evolving data and analytics platform: moving Services’ delivery from reactive 3 to predictive Proven Operating Model powers scale, efficiency and durability - 4 underpinning a culture of collaboration, innovation, and execution Industry-leading service model with >75% of revenue coming from multi-year, 5 subscription-like service contracts; driving new long-term 12-14% CAGR, up from 9-11% 88
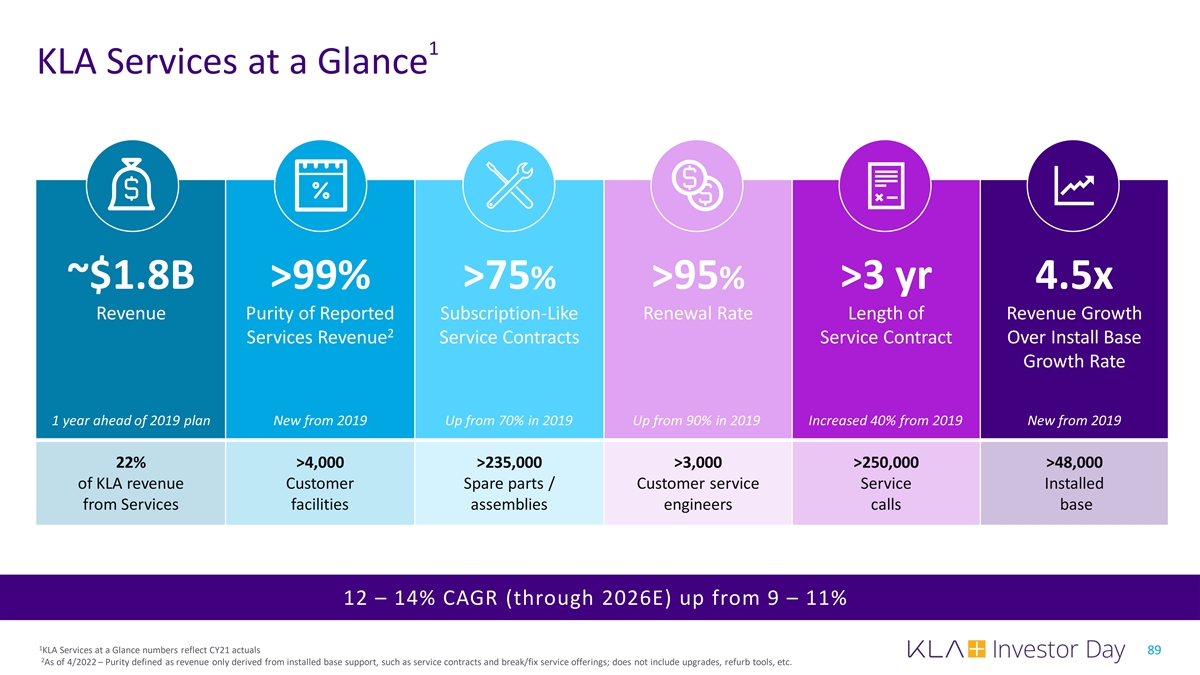
1 KLA Services at a Glance ~$1.8B >99% >75% >95% >3 yr 4.5x Revenue Purity of Reported Subscription-Like Renewal Rate Length of Revenue Growth 2 Services Revenue Service Contracts Service Contract Over Install Base Growth Rate 1 year ahead of 2019 plan New from 2019 Up from 70% in 2019 Up from 90% in 2019 Increased 40% from 2019 New from 2019 22% >4,000 >235,000 >3,000 >250,000 >48,000 of KLA revenue Customer Spare parts / Customer service Service Installed from Services facilities assemblies engineers calls base 12 – 14% CAGR (through 2026E) up from 9 – 11% 1 KLA Services at a Glance numbers reflect CY21 actuals 89 2 As of 4/2022 – Purity defined as revenue only derived from installed base support, such as service contracts and break/fix service offerings; does not include upgrades, refurb tools, etc.
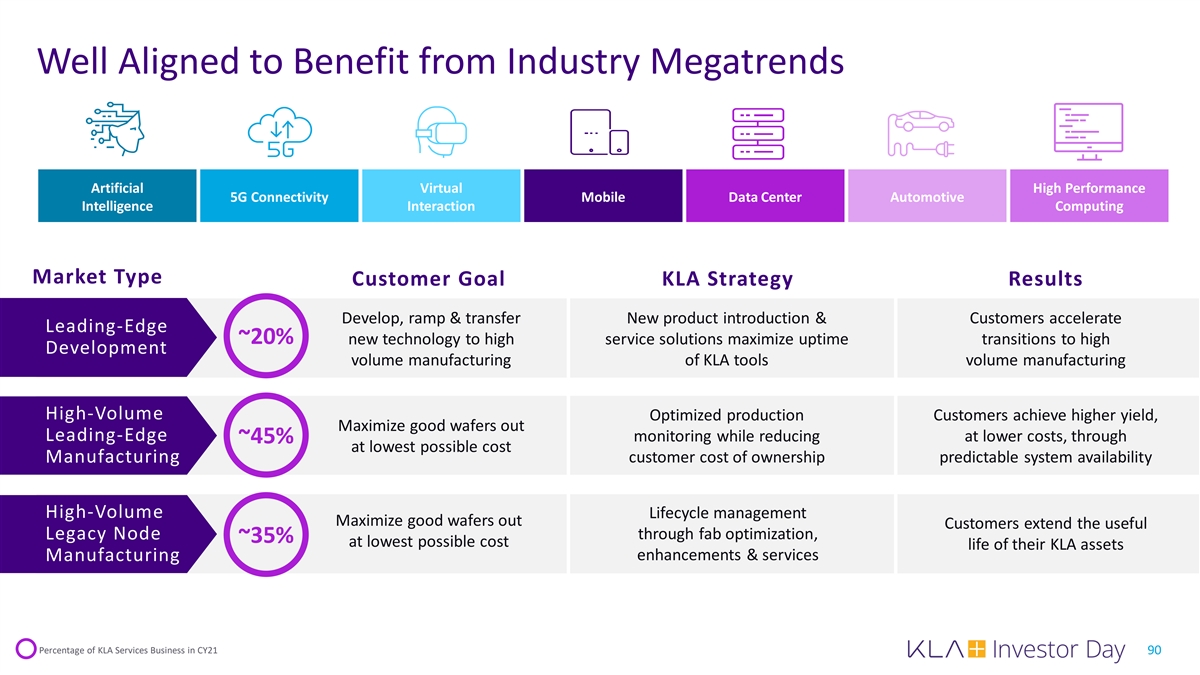
Well Aligned to Benefit from Industry Megatrends Artificial Virtual High Performance 5G Connectivity Mobile Data Center Automotive Intelligence Interaction Computing Market Type Customer Goal KLA Strategy Results Develop, ramp & transfer New product introduction & Customers accelerate Leading-Edge ~20% new technology to high service solutions maximize uptime transitions to high Development volume manufacturing of KLA tools volume manufacturing High-Volume Optimized production Customers achieve higher yield, Maximize good wafers out Leading-Edge monitoring while reducing at lower costs, through ~45% at lowest possible cost Manufacturing customer cost of ownership predictable system availability High-Volume Lifecycle management Maximize good wafers out Customers extend the useful Legacy Node through fab optimization, ~35% at lowest possible cost life of their KLA assets enhancements & services Manufacturing Percentage of KLA Services Business in CY21 90
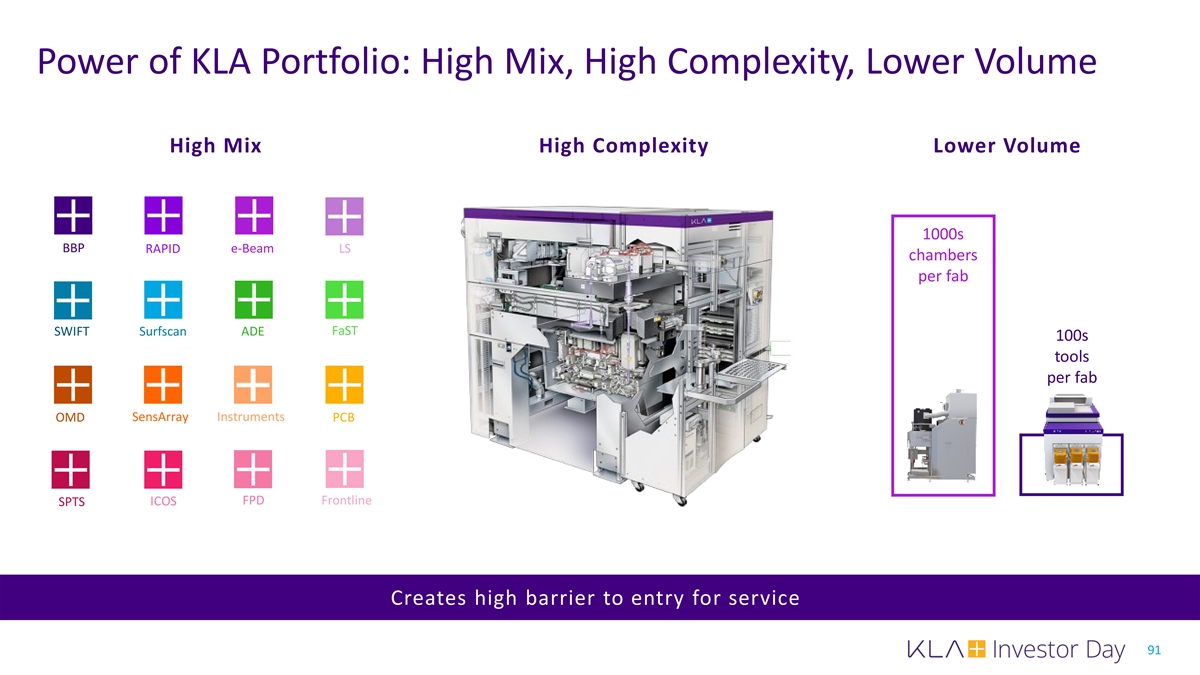
Power of KLA Portfolio: High Mix, High Complexity, Lower Volume High Mix High Complexity Lower Volume 1000s BBP e-Beam LS RAPID chambers per fab FaST SWIFT Surfscan ADE 100s tools per fab OMD SensArray Instruments PCB ICOS FPD Frontline SPTS Creates high barrier to entry for service 91
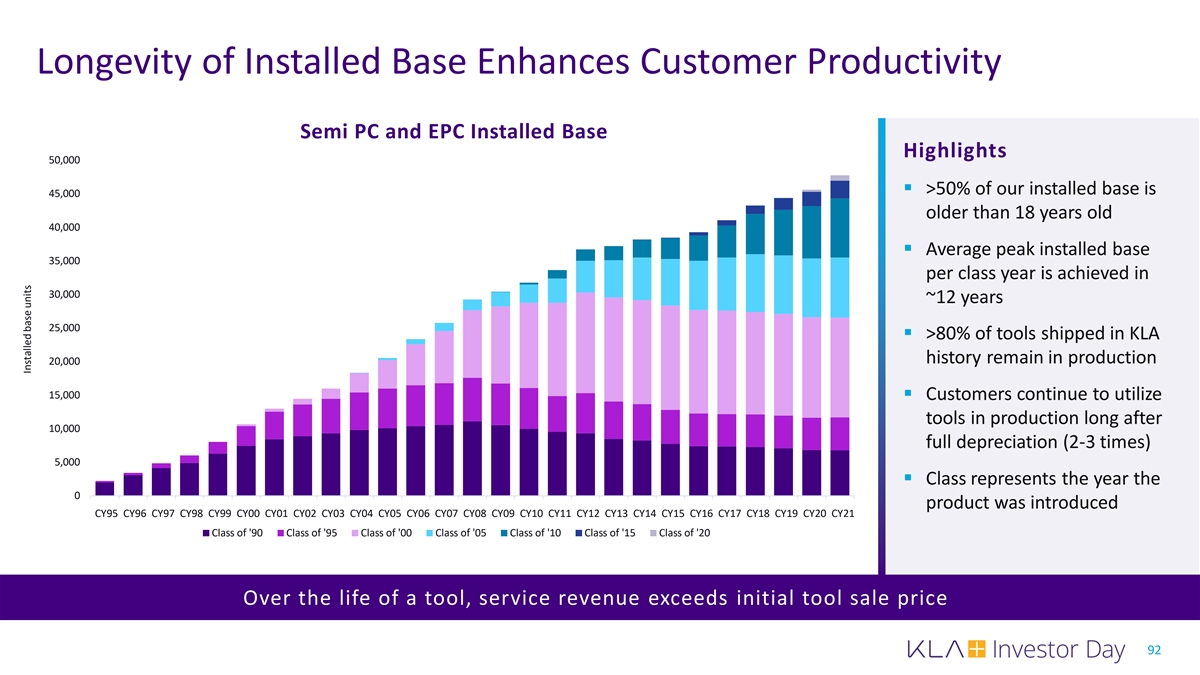
Longevity of Installed Base Enhances Customer Productivity Semi PC and EPC Installed Base Highlights 50,000 § >50% of our installed base is 45,000 older than 18 years old 40,000 § Average peak installed base 35,000 per class year is achieved in 30,000 ~12 years 25,000 § >80% of tools shipped in KLA history remain in production 20,000 15,000 § Customers continue to utilize tools in production long after 10,000 full depreciation (2-3 times) 5,000 § Class represents the year the 0 product was introduced 1995 1996 1997 1998 1999 2000 2001 2002 2003 2004 2005 2006 2007 2008 2009 2010 2011 2012 2013 2014 2015 2016 2017 2018 2019 2020 2021 CY95 CY96 CY97 CY98 CY99 CY00 CY01 CY02 CY03 CY04 CY05 CY06 CY07 CY08 CY09 CY10 CY11 CY12 CY13 CY14 CY15 CY16 CY17 CY18 CY19 CY20 CY21 Class of '90 Class of '95 Class of '00 Class of '05 Class of '10 Class of '15 Class of '20 Over the life of a tool, service revenue exceeds initial tool sale price 92 Installed base units
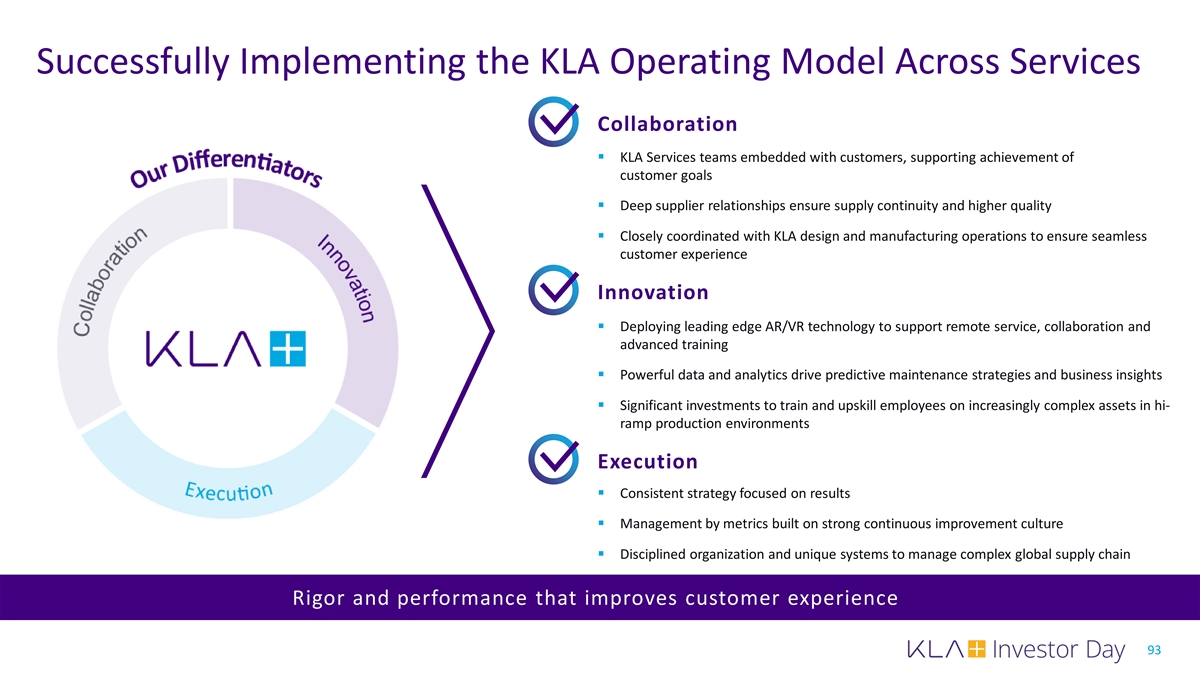
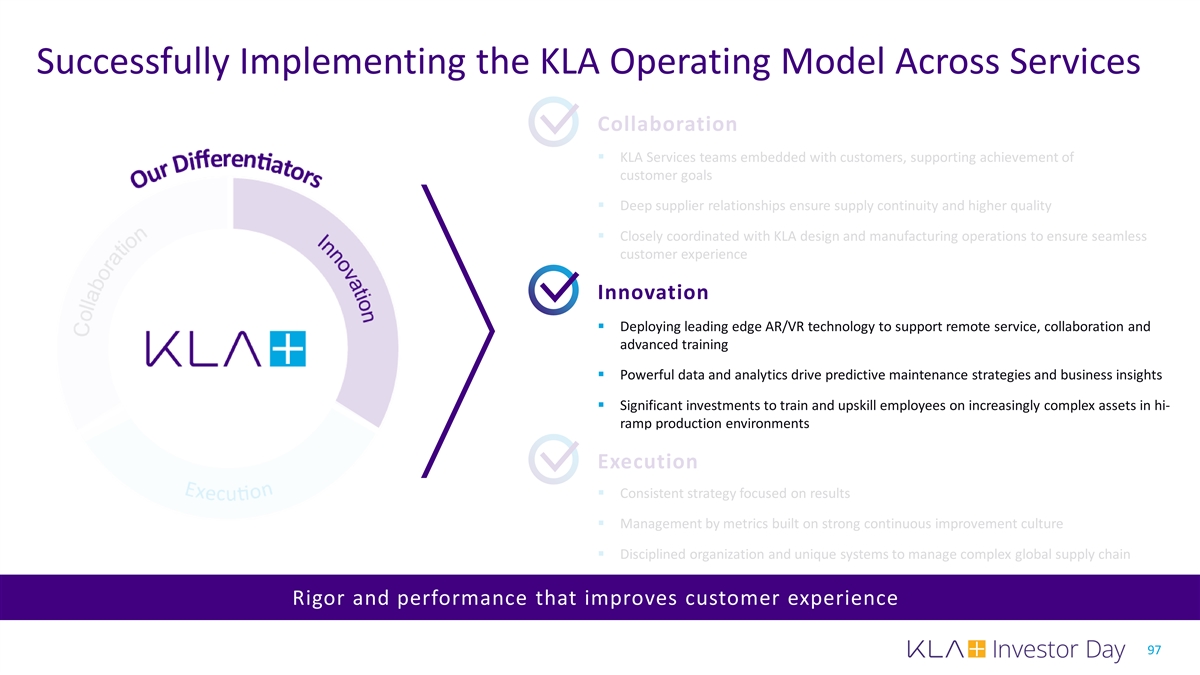
Successfully Implementing the KLA Operating Model Across Services Collaboration § KLA Services teams embedded with customers, supporting achievement of customer goals § Deep supplier relationships ensure supply continuity and higher quality § Closely coordinated with KLA design and manufacturing operations to ensure seamless customer experience Innovation § Deploying leading edge AR/VR technology to support remote service, collaboration and advanced training § Powerful data and analytics drive predictive maintenance strategies and business insights § Significant investments to train and upskill employees on increasingly complex assets in hi- ramp production environments Execution § Consistent strategy focused on results § Management by metrics built on strong continuous improvement culture § Disciplined organization and unique systems to manage complex global supply chain Rigor and performance that improves customer experience 93
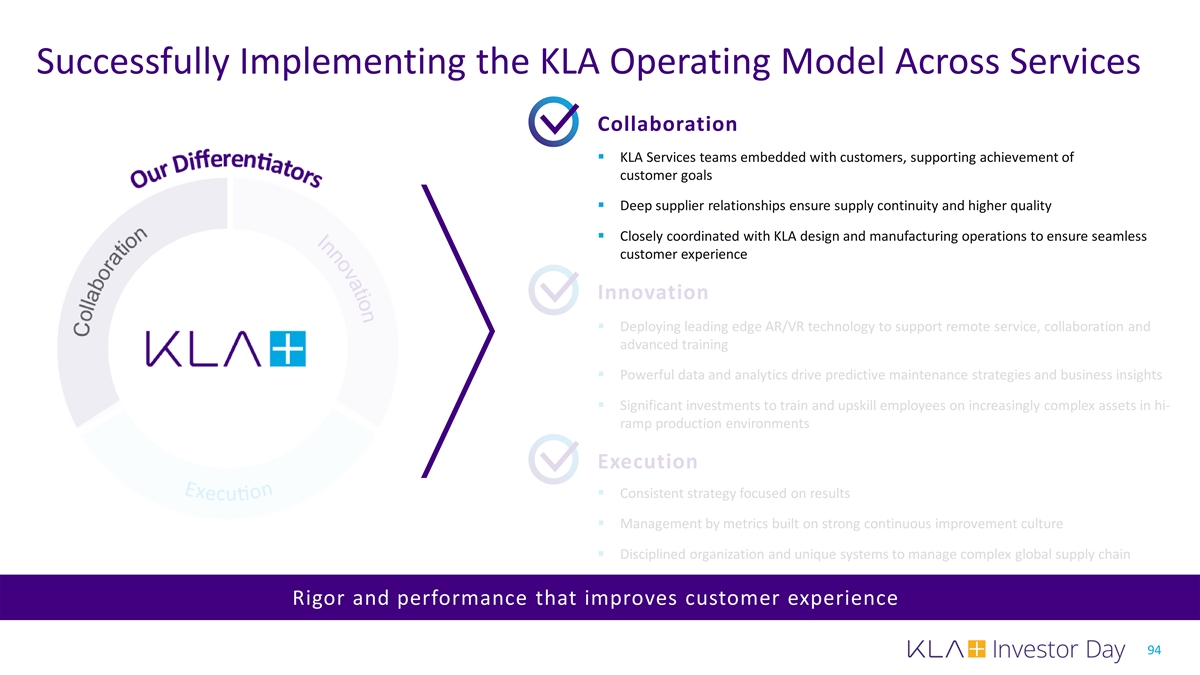
Successfully Implementing the KLA Operating Model Across Services Collaboration § KLA Services teams embedded with customers, supporting achievement of customer goals § Deep supplier relationships ensure supply continuity and higher quality § Closely coordinated with KLA design and manufacturing operations to ensure seamless customer experience Innovation § Deploying leading edge AR/VR technology to support remote service, collaboration and advanced training § Powerful data and analytics drive predictive maintenance strategies and business insights § Significant investments to train and upskill employees on increasingly complex assets in hi- ramp production environments Execution § Consistent strategy focused on results § Management by metrics built on strong continuous improvement culture § Disciplined organization and unique systems to manage complex global supply chain Rigor and performance that improves customer experience 94
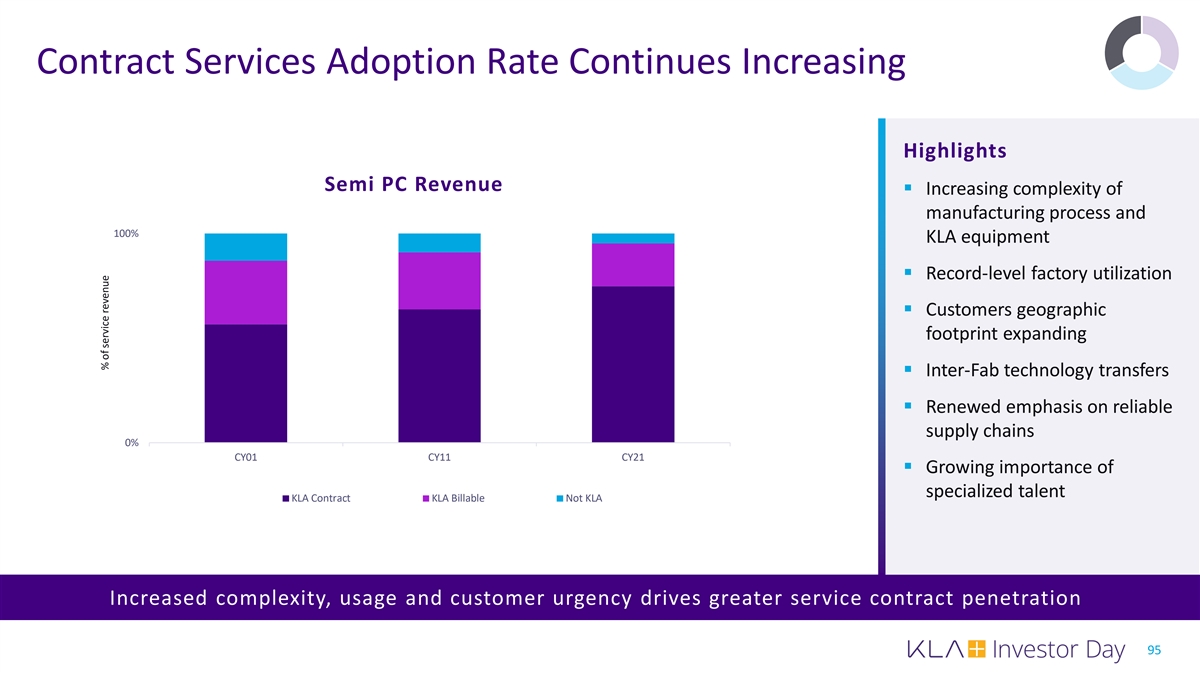
Contract Services Adoption Rate Continues Increasing Highlights Semi PC Revenue § Increasing complexity of manufacturing process and 100% KLA equipment § Record-level factory utilization § Customers geographic footprint expanding § Inter-Fab technology transfers § Renewed emphasis on reliable supply chains 0% CY01 CY11 CY21 § Growing importance of specialized talent KLA Contract KLA Billable Not KLA Increased complexity, usage and customer urgency drives greater service contract penetration 95 % of service revenue
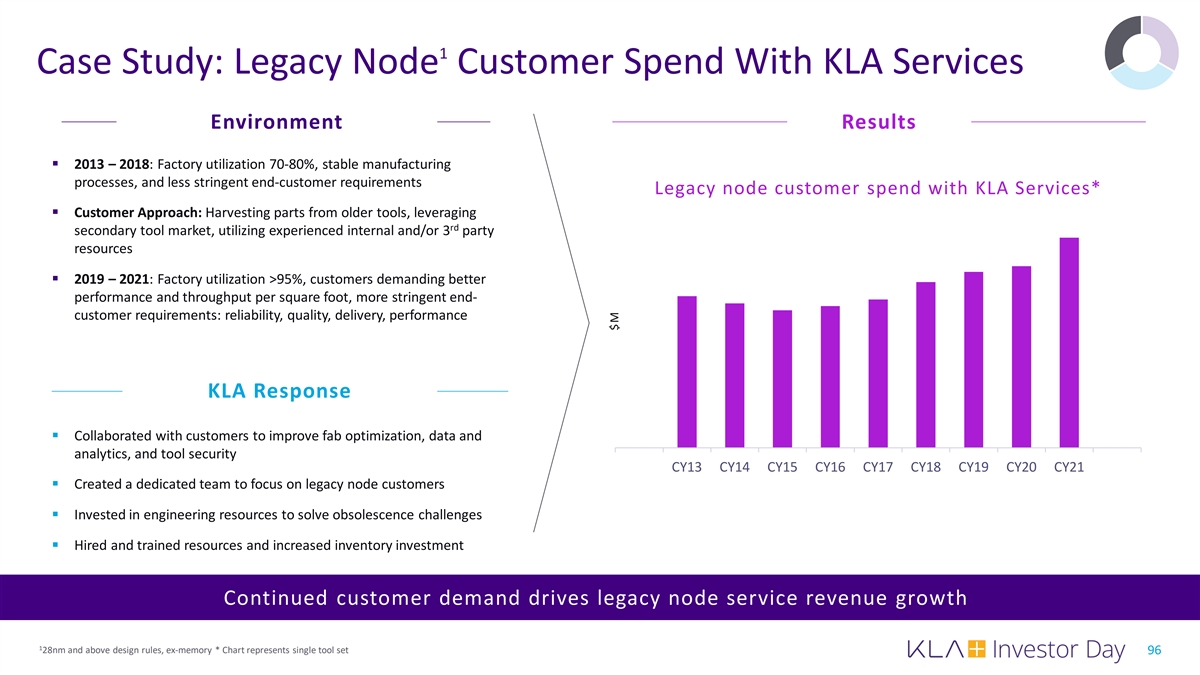
1 Case Study: Legacy Node Customer Spend With KLA Services Environment Results § 2013 – 2018: Factory utilization 70-80%, stable manufacturing processes, and less stringent end-customer requirements Legacy node customer spend with KLA Services* § Customer Approach: Harvesting parts from older tools, leveraging rd secondary tool market, utilizing experienced internal and/or 3 party resources § 2019 – 2021: Factory utilization >95%, customers demanding better performance and throughput per square foot, more stringent end- customer requirements: reliability, quality, delivery, performance KLA Response § Collaborated with customers to improve fab optimization, data and analytics, and tool security CY13 CY14 CY15 CY16 CY17 CY18 CY19 CY20 CY21 § Created a dedicated team to focus on legacy node customers § Invested in engineering resources to solve obsolescence challenges § Hired and trained resources and increased inventory investment Continued customer demand drives legacy node service revenue growth 1 28nm and above design rules, ex-memory * Chart represents single tool set 96 $M
Successfully Implementing the KLA Operating Model Across Services Collaboration § KLA Services teams embedded with customers, supporting achievement of customer goals § Deep supplier relationships ensure supply continuity and higher quality § Closely coordinated with KLA design and manufacturing operations to ensure seamless customer experience Innovation § Deploying leading edge AR/VR technology to support remote service, collaboration and advanced training § Powerful data and analytics drive predictive maintenance strategies and business insights § Significant investments to train and upskill employees on increasingly complex assets in hi- ramp production environments Execution § Consistent strategy focused on results § Management by metrics built on strong continuous improvement culture § Disciplined organization and unique systems to manage complex global supply chain Rigor and performance that improves customer experience 97
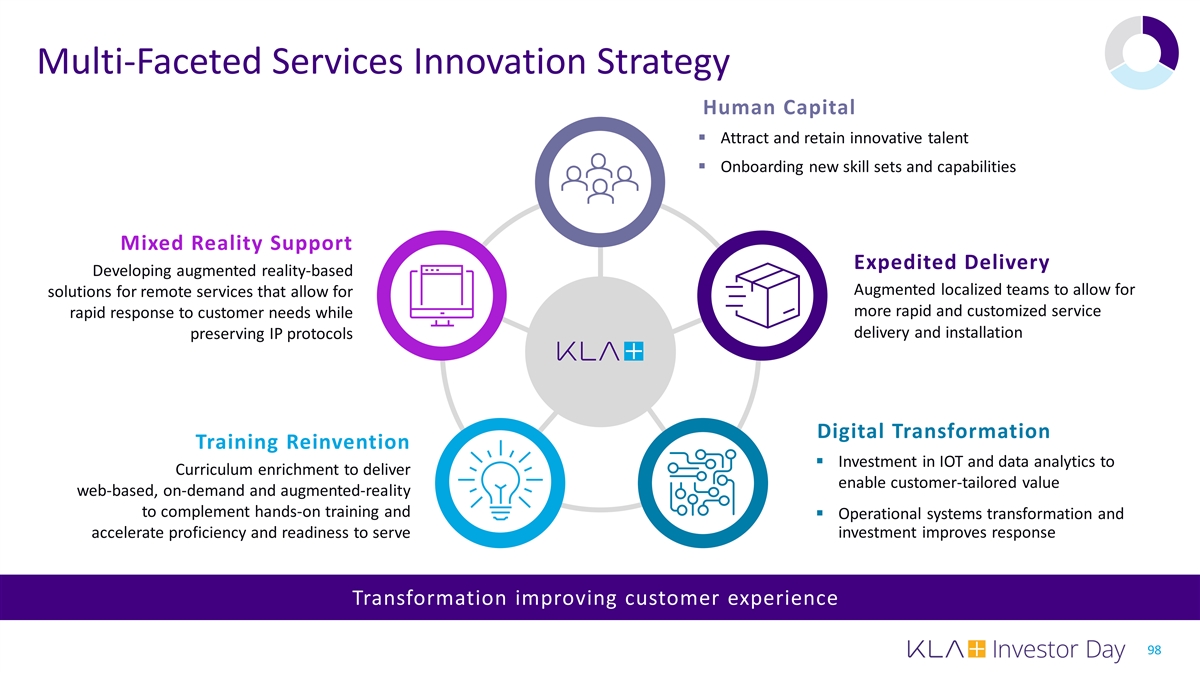
Multi-Faceted Services Innovation Strategy Human Capital § Attract and retain innovative talent § Onboarding new skill sets and capabilities Mixed Reality Support Expedited Delivery Developing augmented reality-based Augmented localized teams to allow for solutions for remote services that allow for more rapid and customized service rapid response to customer needs while delivery and installation preserving IP protocols Digital Transformation Training Reinvention § Investment in IOT and data analytics to Curriculum enrichment to deliver enable customer-tailored value web-based, on-demand and augmented-reality to complement hands-on training and § Operational systems transformation and accelerate proficiency and readiness to serve investment improves response Transformation improving customer experience 98
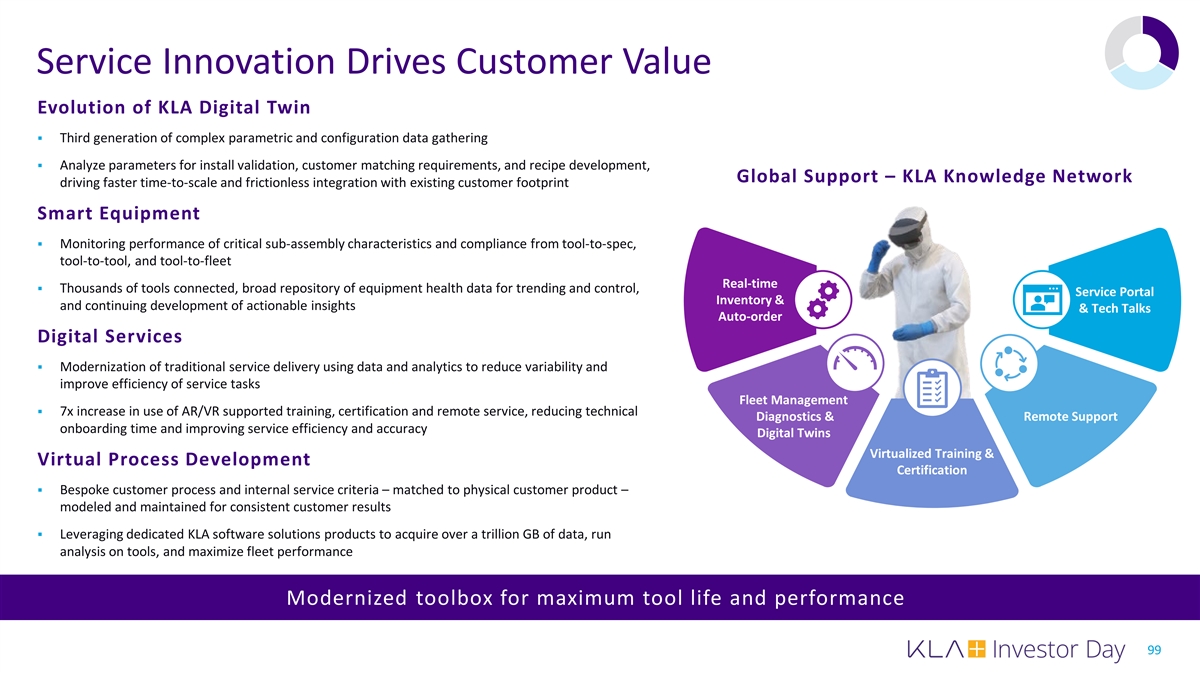
Service Innovation Drives Customer Value Evolution of KLA Digital Twin § Third generation of complex parametric and configuration data gathering § Analyze parameters for install validation, customer matching requirements, and recipe development, Global Support – KLA Knowledge Network driving faster time-to-scale and frictionless integration with existing customer footprint Smart Equipment § Monitoring performance of critical sub-assembly characteristics and compliance from tool-to-spec, tool-to-tool, and tool-to-fleet Real-time § Thousands of tools connected, broad repository of equipment health data for trending and control, Service Portal Inventory & and continuing development of actionable insights & Tech Talks Auto-order Digital Services § Modernization of traditional service delivery using data and analytics to reduce variability and improve efficiency of service tasks Fleet Management § 7x increase in use of AR/VR supported training, certification and remote service, reducing technical Diagnostics & Remote Support onboarding time and improving service efficiency and accuracy Digital Twins Virtualized Training & Virtual Process Development Certification § Bespoke customer process and internal service criteria – matched to physical customer product – modeled and maintained for consistent customer results § Leveraging dedicated KLA software solutions products to acquire over a trillion GB of data, run analysis on tools, and maximize fleet performance Modernized toolbox for maximum tool life and performance 99
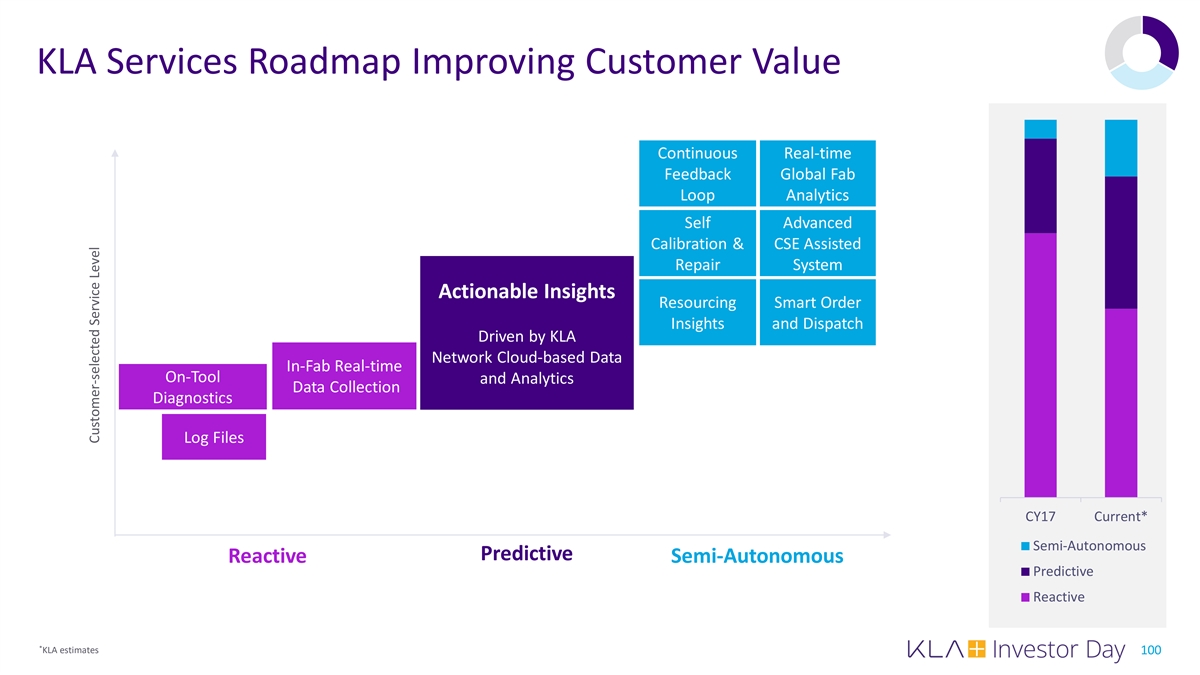
KLA Services Roadmap Improving Customer Value Continuous Real-time Feedback Global Fab Loop Analytics Self Advanced Calibration & CSE Assisted Repair System Actionable Insights Resourcing Smart Order Insights and Dispatch Driven by KLA Network Cloud-based Data In-Fab Real-time On-Tool and Analytics Data Collection Diagnostics Log Files CY17 Current* Semi-Autonomous Predictive Reactive Semi-Autonomous Predictive Reactive * KLA estimates 100 Customer-selected Service Level
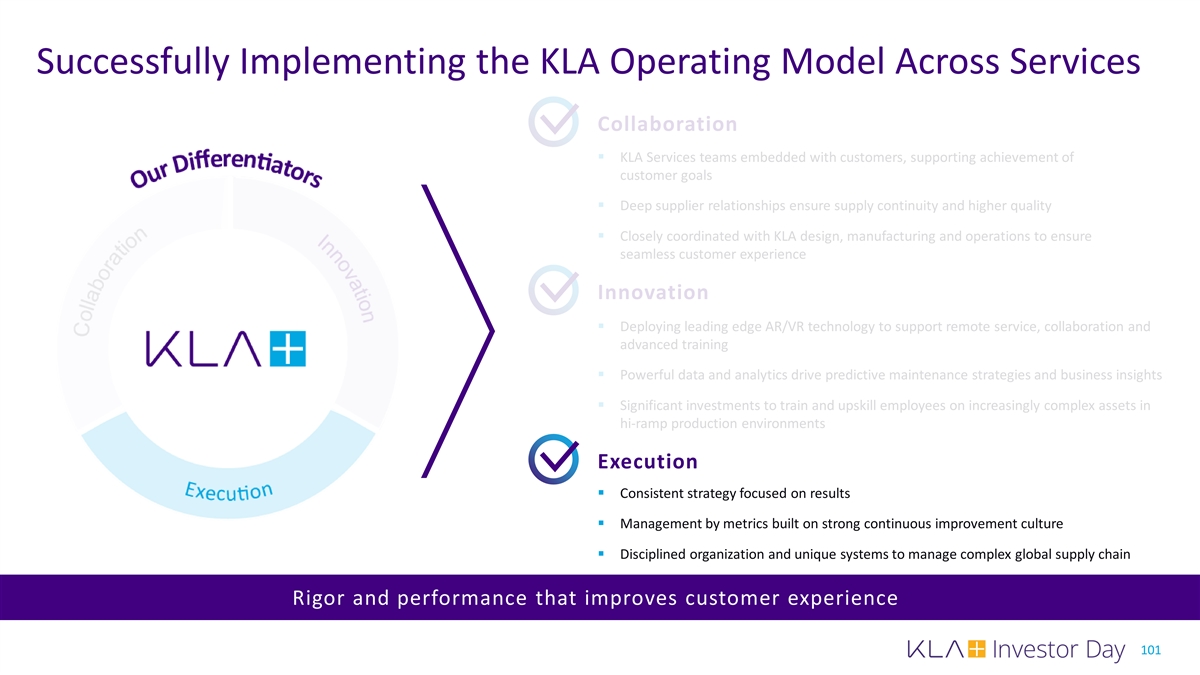
Successfully Implementing the KLA Operating Model Across Services Collaboration § KLA Services teams embedded with customers, supporting achievement of customer goals § Deep supplier relationships ensure supply continuity and higher quality § Closely coordinated with KLA design, manufacturing and operations to ensure seamless customer experience Innovation § Deploying leading edge AR/VR technology to support remote service, collaboration and advanced training § Powerful data and analytics drive predictive maintenance strategies and business insights § Significant investments to train and upskill employees on increasingly complex assets in hi-ramp production environments Execution § Consistent strategy focused on results § Management by metrics built on strong continuous improvement culture § Disciplined organization and unique systems to manage complex global supply chain Rigor and performance that improves customer experience 101
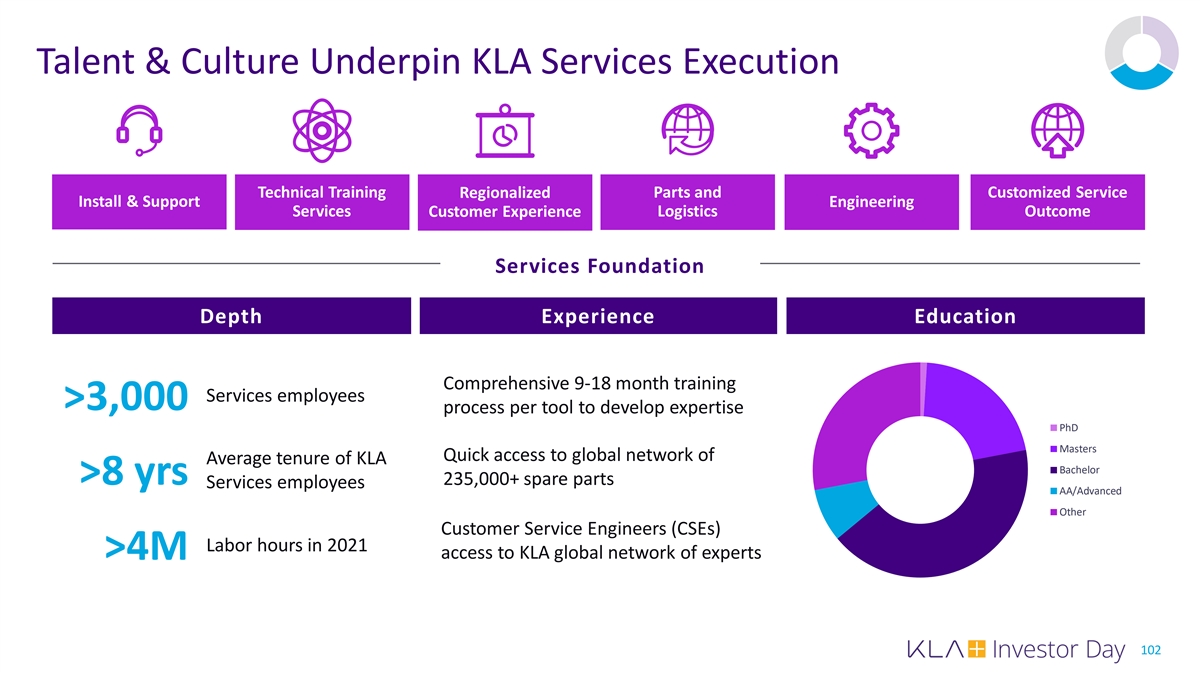
Talent & Culture Underpin KLA Services Execution Technical Training Parts and Customized Service Regionalized Install & Support Engineering Services Logistics Outcome Customer Experience Services Foundation Depth Experience Education Comprehensive 9-18 month training Services employees >3,000 process per tool to develop expertise PhD Masters Quick access to global network of Average tenure of KLA Bachelor >8 yrs 235,000+ spare parts Services employees AA/Advanced Other Customer Service Engineers (CSEs) Labor hours in 2021 access to KLA global network of experts >4M 102
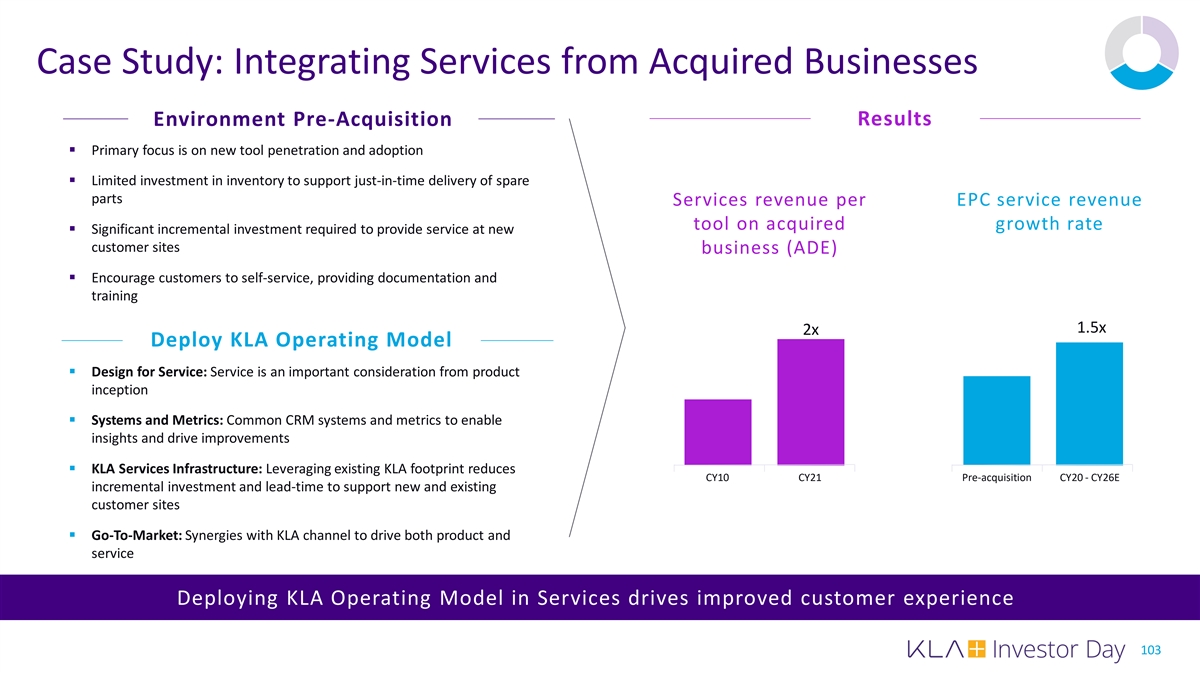
Case Study: Integrating Services from Acquired Businesses Environment Pre-Acquisition Results § Primary focus is on new tool penetration and adoption § Limited investment in inventory to support just-in-time delivery of spare parts Services revenue per EPC service revenue tool on acquired growth rate § Significant incremental investment required to provide service at new customer sites business (ADE) § Encourage customers to self-service, providing documentation and training 1.5x 2x Deploy KLA Operating Model § Design for Service: Service is an important consideration from product inception § Systems and Metrics: Common CRM systems and metrics to enable insights and drive improvements § KLA Services Infrastructure: Leveraging existing KLA footprint reduces CY10 CY21 Pre-acquisition CY20 - CY26E incremental investment and lead-time to support new and existing customer sites § Go-To-Market: Synergies with KLA channel to drive both product and service Deploying KLA Operating Model in Services drives improved customer experience 103
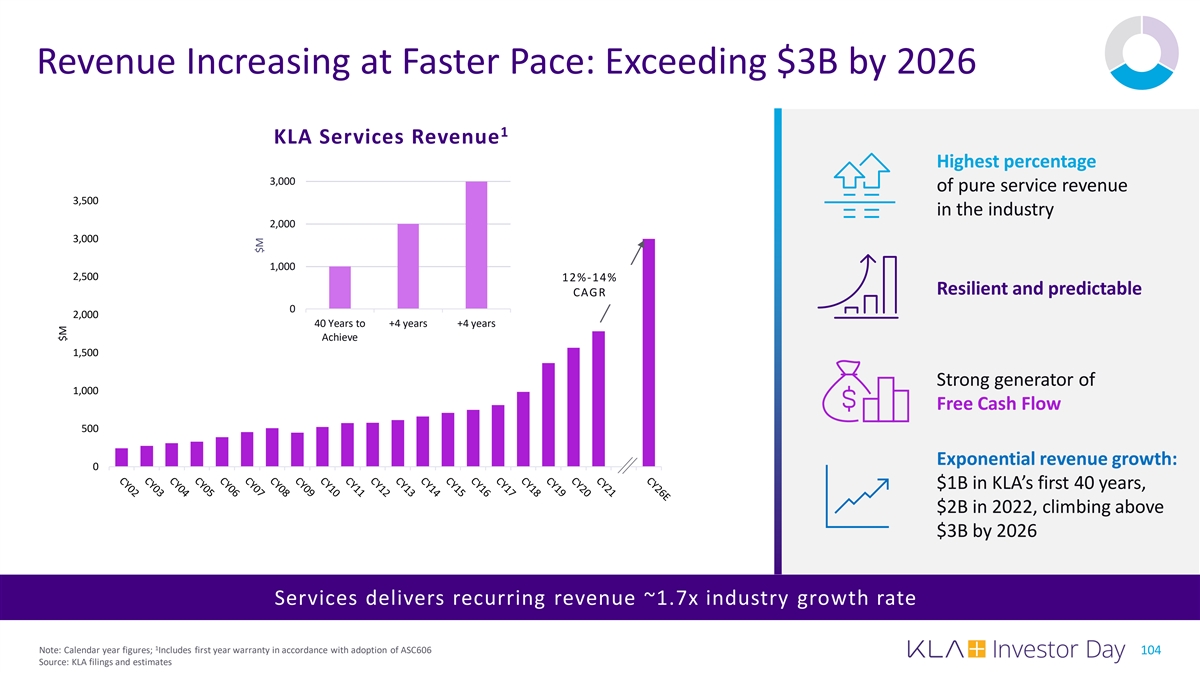
Revenue Increasing at Faster Pace: Exceeding $3B by 2026 1 KLA Services Revenue Highest percentage 3,000 of pure service revenue 3,500 in the industry 2,000 3,000 1,000 2,500 12%-14% Resilient and predictable CAGR 0 2,000 40 Years to +4 years +4 years Achieve 1,500 Strong generator of 1,000 Free Cash Flow 500 Exponential revenue growth: 0 $1B in KLA’s first 40 years, $2B in 2022, climbing above $3B by 2026 Services delivers recurring revenue ~1.7x industry growth rate 1 Note: Calendar year figures; Includes first year warranty in accordance with adoption of ASC606 104 Source: KLA filings and estimates $M $M
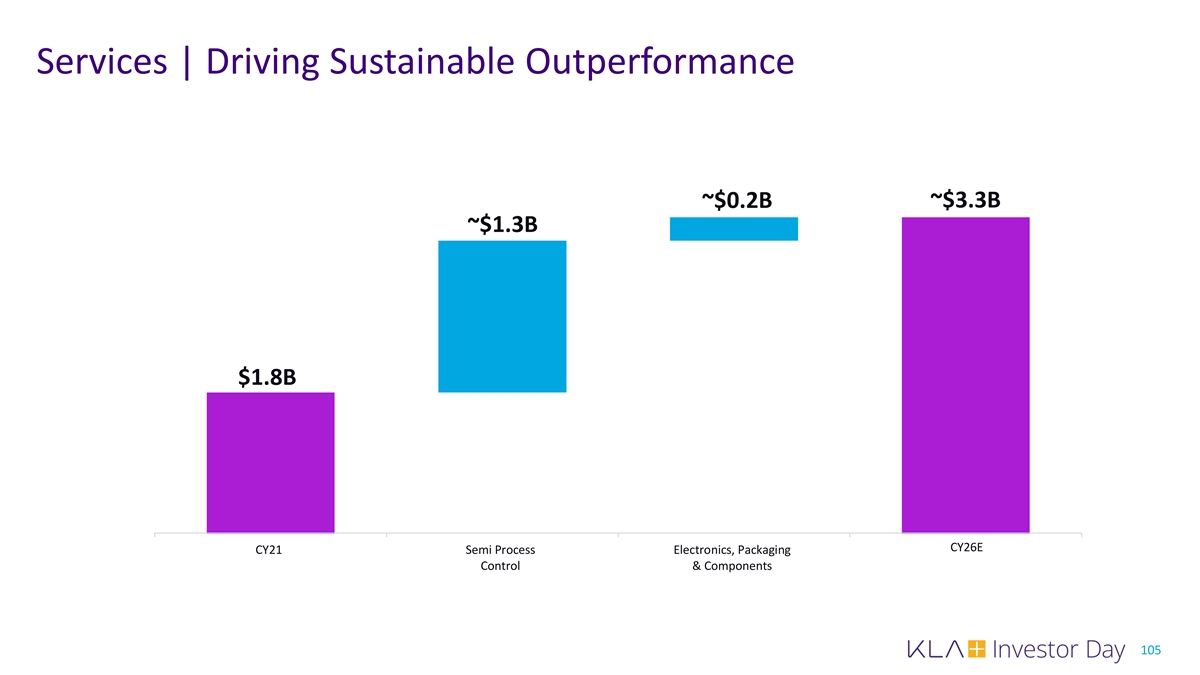
Services | Driving Sustainable Outperformance ~$3.3B ~$0.2B ~$1.3B $1.8B CY26E CY21 Semi Process Electronics, Packaging CY26 Estimate Control & Components 105
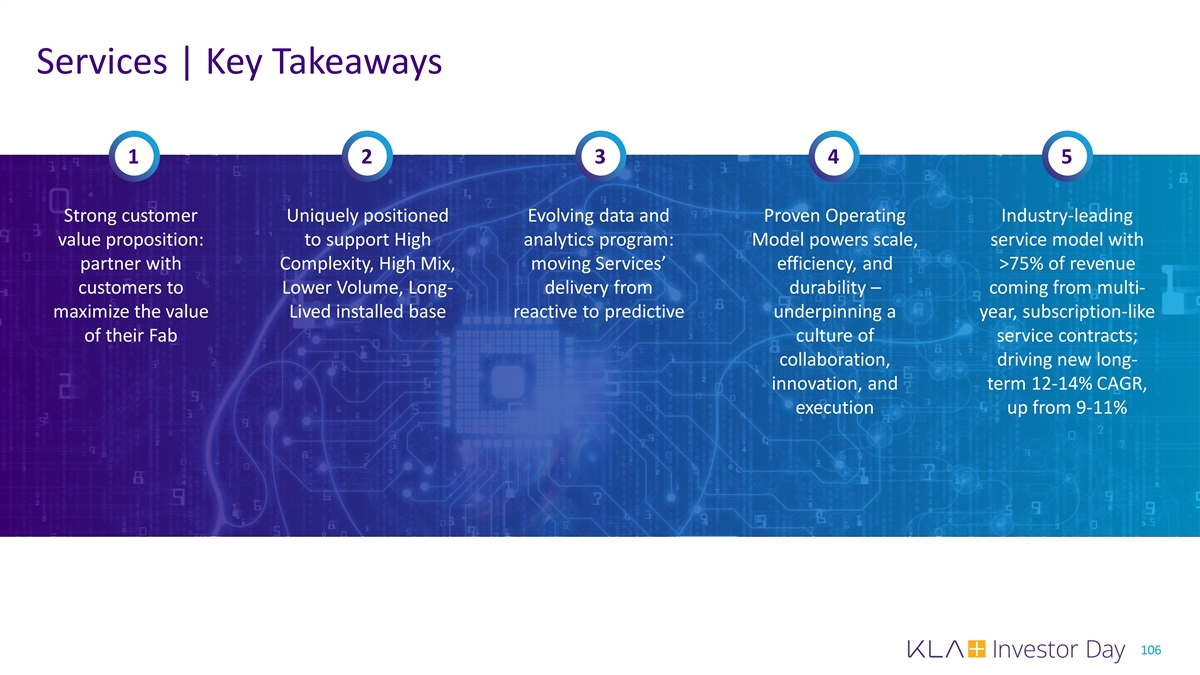
Services | Key Takeaways 1 2 3 4 5 Strong customer Uniquely positioned Evolving data and Proven Operating Industry-leading value proposition: to support High analytics program: Model powers scale, service model with partner with Complexity, High Mix, moving Services’ efficiency, and >75% of revenue customers to Lower Volume, Long- delivery from durability – coming from multi- maximize the value Lived installed base reactive to predictive underpinning a year, subscription-like of their Fab culture of service contracts; collaboration, driving new long- innovation, and term 12-14% CAGR, execution up from 9-11% 106
Long-Term Target Model & Capital Return Strategy Bren Higgins EVP and CFO
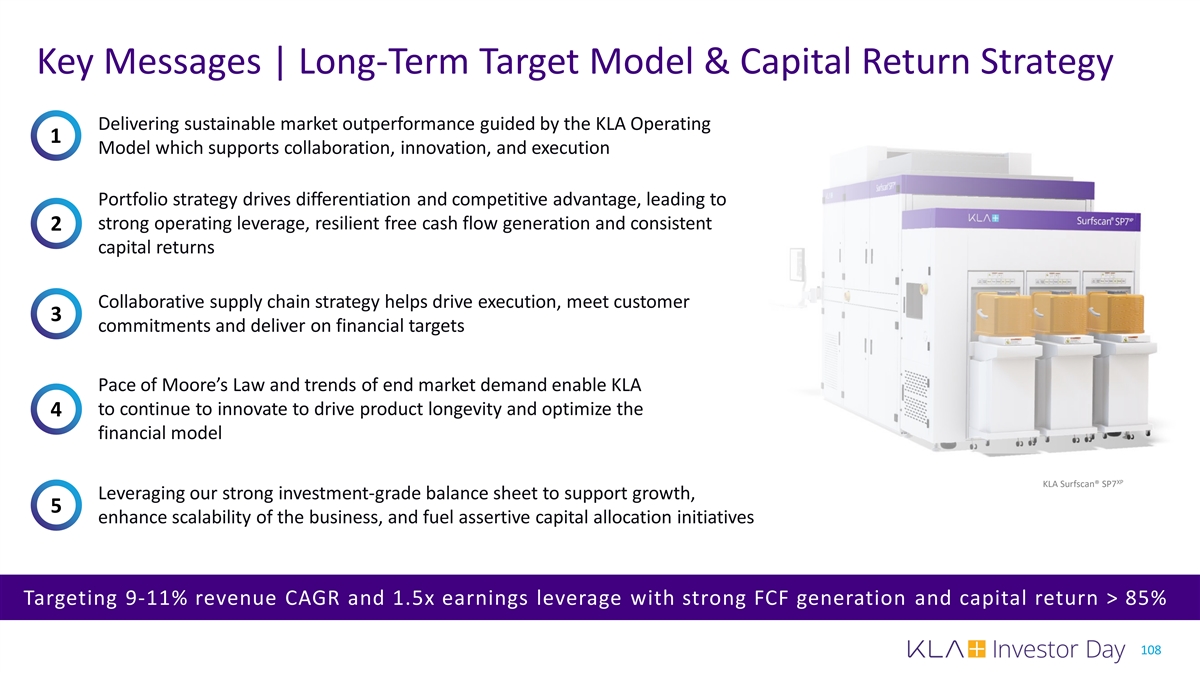
Key Messages | Long-Term Target Model & Capital Return Strategy Delivering sustainable market outperformance guided by the KLA Operating 1 Model which supports collaboration, innovation, and execution Portfolio strategy drives differentiation and competitive advantage, leading to strong operating leverage, resilient free cash flow generation and consistent 2 capital returns Collaborative supply chain strategy helps drive execution, meet customer 3 commitments and deliver on financial targets Pace of Moore’s Law and trends of end market demand enable KLA to continue to innovate to drive product longevity and optimize the 4 financial model XP KLA Surfscan® SP7 Leveraging our strong investment-grade balance sheet to support growth, 5 enhance scalability of the business, and fuel assertive capital allocation initiatives Targeting 9-11% revenue CAGR and 1.5x earnings leverage with strong FCF generation and capital return > 85% 108
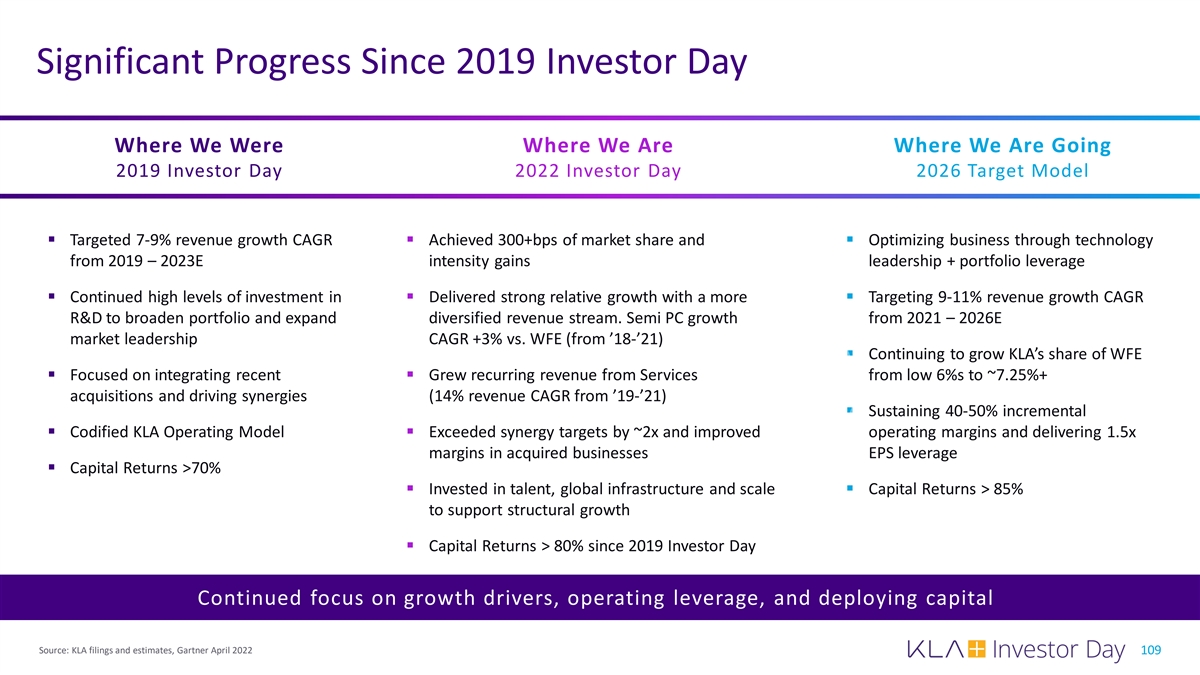
Significant Progress Since 2019 Investor Day Where We Were Where We Are Where We Are Going 2019 Investor Day 2022 Investor Day 2026 Target Model § Targeted 7-9% revenue growth CAGR § Achieved 300+bps of market share and § Optimizing business through technology from 2019 – 2023E intensity gains leadership + portfolio leverage § Continued high levels of investment in § Delivered strong relative growth with a more § Targeting 9-11% revenue growth CAGR R&D to broaden portfolio and expand diversified revenue stream. Semi PC growth from 2021 – 2026E market leadership CAGR +3% vs. WFE (from ’18-’21) § Continuing to grow KLA’s share of WFE § Focused on integrating recent § Grew recurring revenue from Services from low 6%s to ~7.25%+ acquisitions and driving synergies (14% revenue CAGR from ’19-’21) § Sustaining 40-50% incremental § Codified KLA Operating Model§ Exceeded synergy targets by ~2x and improved operating margins and delivering 1.5x margins in acquired businesses EPS leverage § Capital Returns >70% § Invested in talent, global infrastructure and scale § Capital Returns > 85% to support structural growth § Capital Returns > 80% since 2019 Investor Day Continued focus on growth drivers, operating leverage, and deploying capital Source: KLA filings and estimates, Gartner April 2022 109
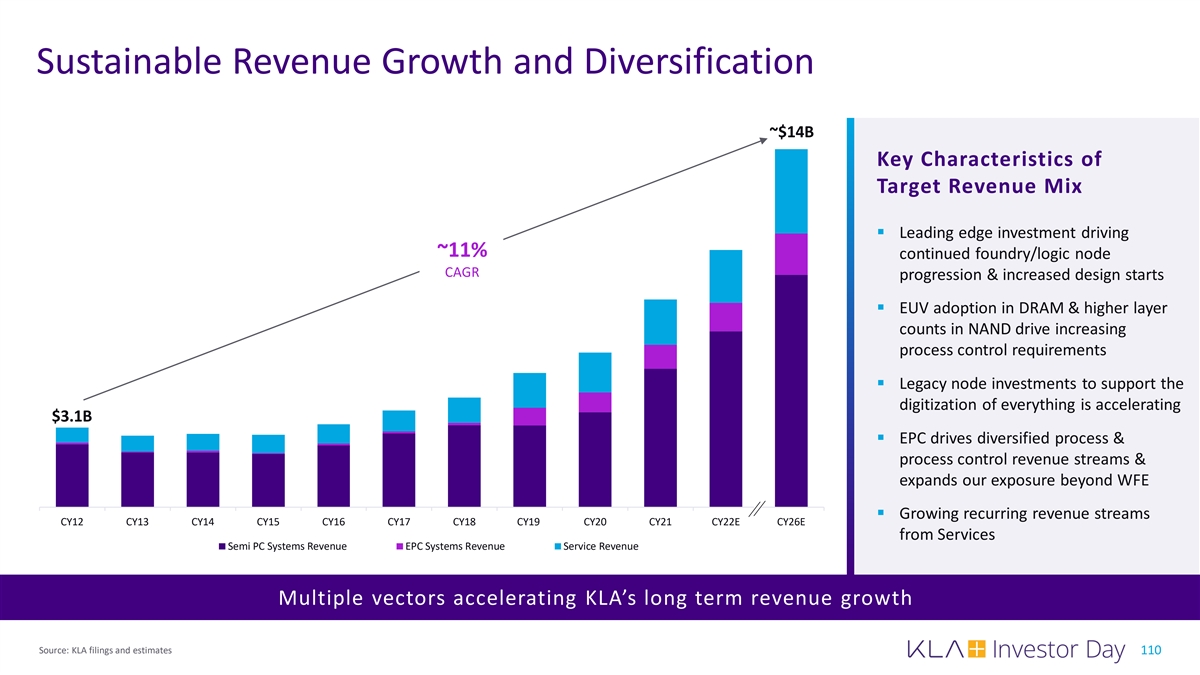
Sustainable Revenue Growth and Diversification ~$14B Key Characteristics of Target Revenue Mix § Leading edge investment driving ~11% continued foundry/logic node CAGR progression & increased design starts § EUV adoption in DRAM & higher layer counts in NAND drive increasing process control requirements § Legacy node investments to support the digitization of everything is accelerating $3.1B § EPC drives diversified process & process control revenue streams & expands our exposure beyond WFE § Growing recurring revenue streams CY12 CY13 CY14 CY15 CY16 CY17 CY18 CY19 CY20 CY21 CY22E CY26E from Services Semi PC Systems Revenue EPC Systems Revenue Service Revenue Multiple vectors accelerating KLA’s long term revenue growth Source: KLA filings and estimates 110
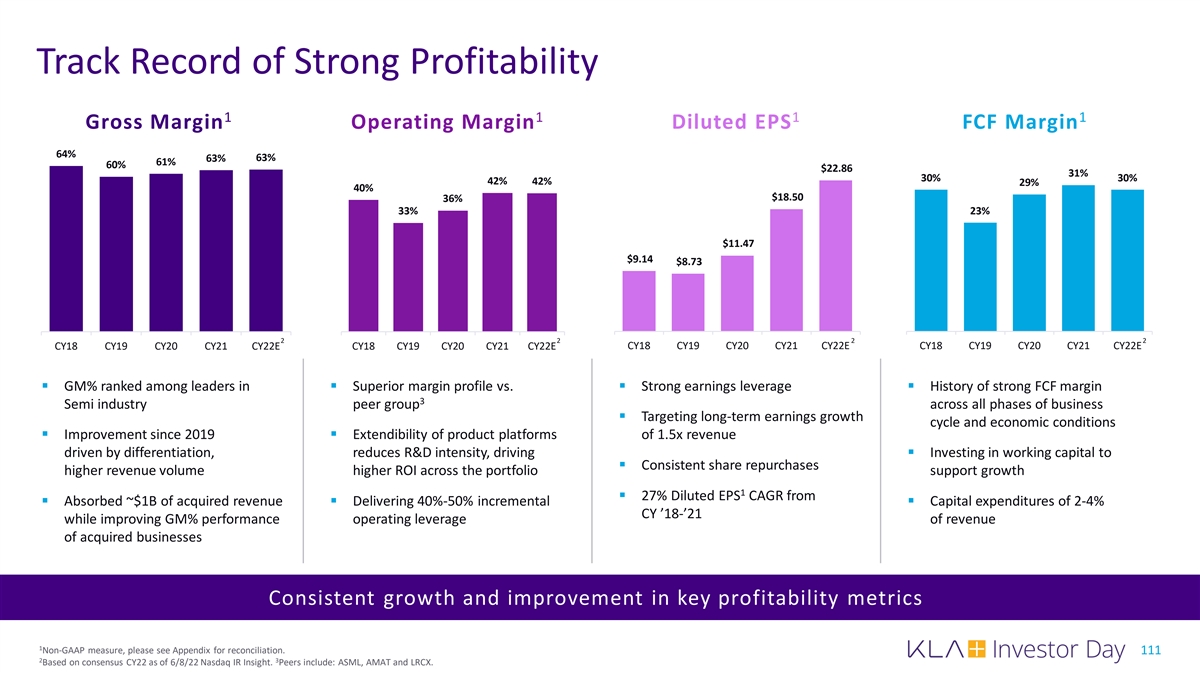
Track Record of Strong Profitability 1 1 1 1 Gross Margin Operating Margin Diluted EPS FCF Margin 64% 63% 63% 61% 60% $22.86 31% 30% 30% 42% 42% 29% 40% $18.50 36% 33% 23% $11.47 $9.14 $8.73 2 2 2 2 CY18 CY19 CY20 CY21 CY22E CY18 CY19 CY20 CY21 CY22E CY18 CY19 CY20 CY21 CY22E CY18 CY19 CY20 CY21 CY22E § GM% ranked among leaders in § Superior margin profile vs. § Strong earnings leverage§ History of strong FCF margin 3 Semi industry peer group across all phases of business § Targeting long-term earnings growth cycle and economic conditions § Improvement since 2019 § Extendibility of product platforms of 1.5x revenue driven by differentiation, reduces R&D intensity, driving § Investing in working capital to § Consistent share repurchases higher revenue volume higher ROI across the portfolio support growth 1 § 27% Diluted EPS CAGR from § Absorbed ~$1B of acquired revenue § Delivering 40%-50% incremental § Capital expenditures of 2-4% CY ’18-’21 while improving GM% performance operating leverage of revenue of acquired businesses Consistent growth and improvement in key profitability metrics 1 Non-GAAP measure, please see Appendix for reconciliation. 111 2 3 Based on consensus CY22 as of 6/8/22 Nasdaq IR Insight. Peers include: ASML, AMAT and LRCX.
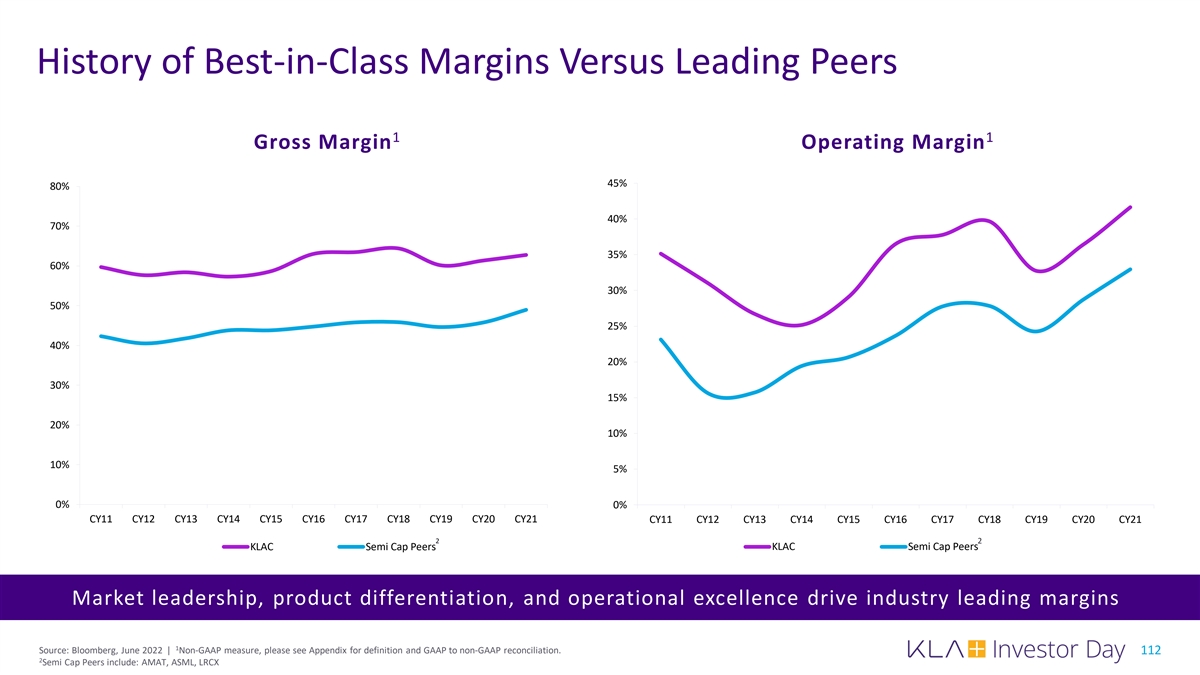
History of Best-in-Class Margins Versus Leading Peers 1 1 Gross Margin Operating Margin 45% 80% 40% 70% 35% 60% 30% 50% 25% 40% 20% 30% 15% 20% 10% 10% 5% 0% 0% CY11 CY12 CY13 CY14 CY15 CY16 CY17 CY18 CY19 CY20 CY21 CY11 CY12 CY13 CY14 CY15 CY16 CY17 CY18 CY19 CY20 CY21 2 2 KLAC Semi Cap Peers KLAC Semi Cap Peers Market leadership, product differentiation, and operational excellence drive industry leading margins 1 Source: Bloomberg, June 2022 | Non-GAAP measure, please see Appendix for definition and GAAP to non-GAAP reconciliation. 112 2 Semi Cap Peers include: AMAT, ASML, LRCX
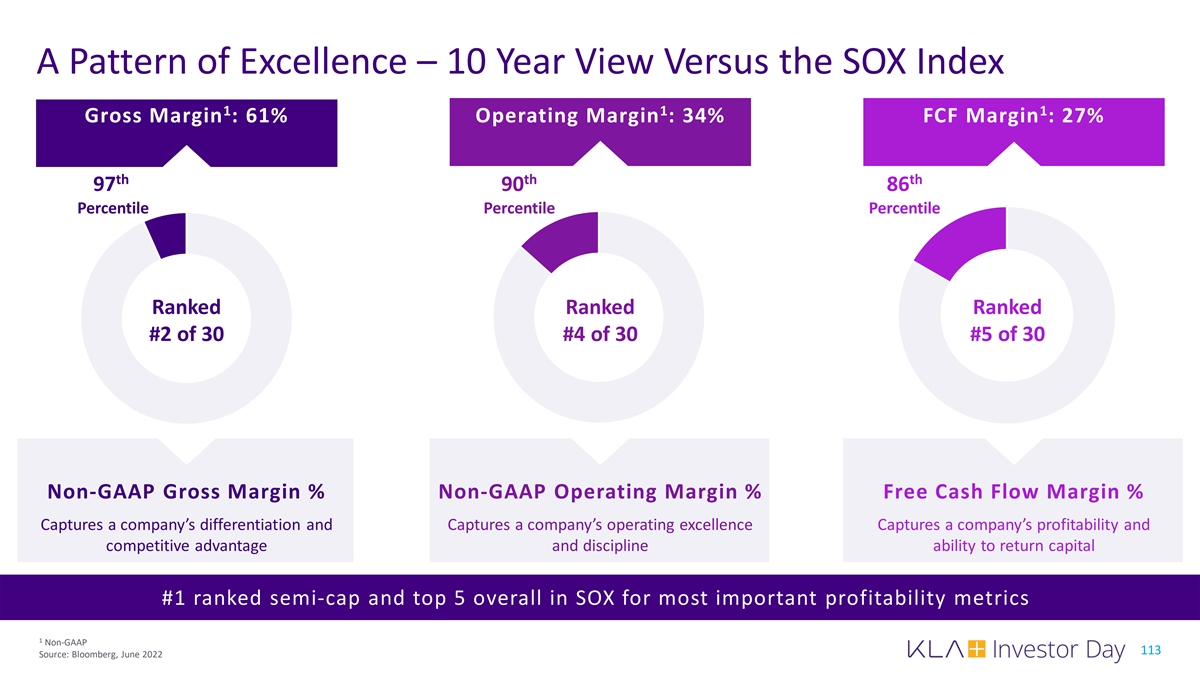
A Pattern of Excellence – 10 Year View Versus the SOX Index 1 1 1 Gross Margin : 61% Operating Margin : 34% FCF Margin : 27% th th th 97 90 86 Percentile Percentile Percentile Ranked Ranked Ranked #2 of 30 #4 of 30 #5 of 30 Non-GAAP Gross Margin % Non-GAAP Operating Margin % Free Cash Flow Margin % Captures a company’s differentiation and Captures a company’s operating excellence Captures a company’s profitability and competitive advantage and discipline ability to return capital #1 ranked semi-cap and top 5 overall in SOX for most important profitability metrics 1 Non-GAAP 113 Source: Bloomberg, June 2022
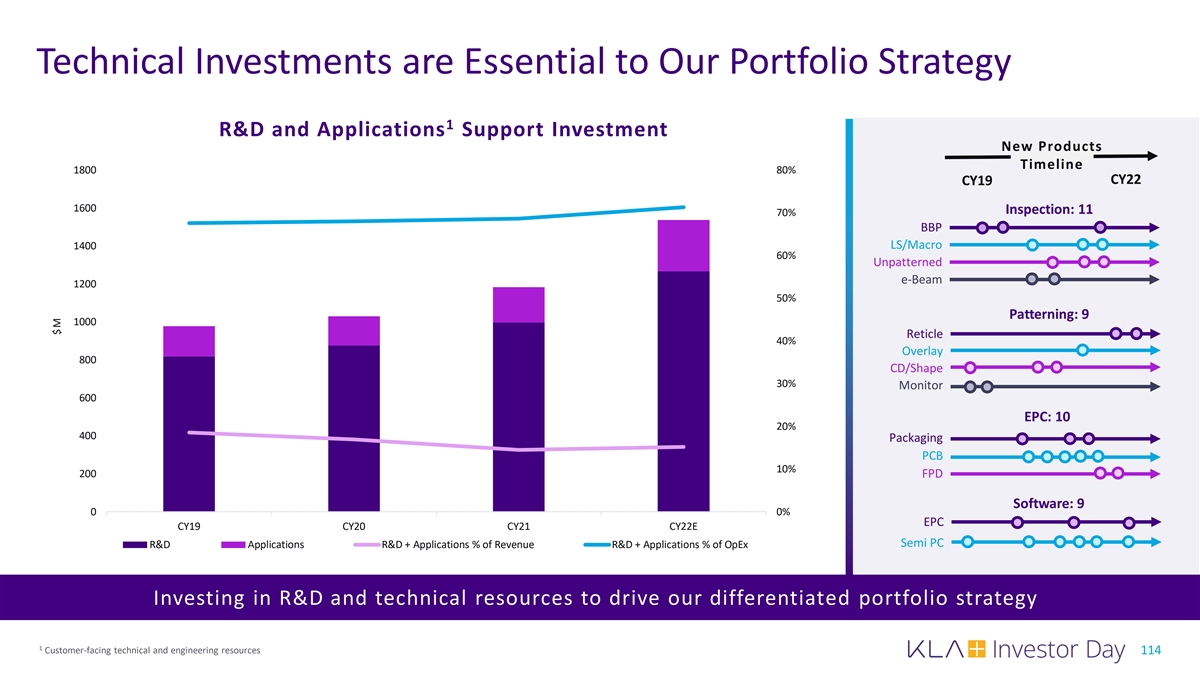
Technical Investments are Essential to Our Portfolio Strategy 1 R&D and Applications Support Investment New Products Timeline 1800 80% CY22 CY19 1600 Inspection: 11 70% BBP LS/Macro 1400 60% Unpatterned e-Beam 1200 50% Patterning: 9 1000 Reticle 40% Overlay 800 CD/Shape 30% Monitor 600 EPC: 10 20% 400 Packaging PCB 10% 200 FPD Software: 9 0 0% EPC CY19 CY20 CY21 CY22E Semi PC R&D Applications R&D + Applications % of Revenue R&D + Applications % of OpEx Investing in R&D and technical resources to drive our differentiated portfolio strategy 1 Customer-facing technical and engineering resources 114 $M
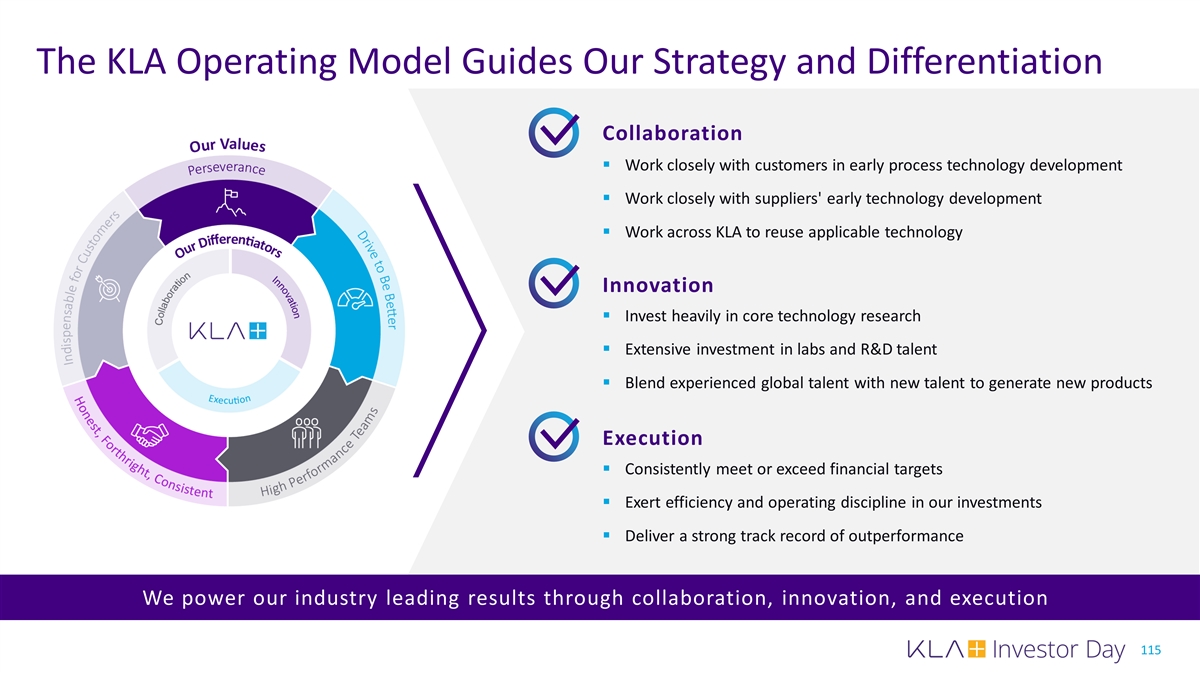
The KLA Operating Model Guides Our Strategy and Differentiation Collaboration § Work closely with customers in early process technology development § Work closely with suppliers' early technology development § Work across KLA to reuse applicable technology Innovation § Invest heavily in core technology research § Extensive investment in labs and R&D talent § Blend experienced global talent with new talent to generate new products Execution § Consistently meet or exceed financial targets § Exert efficiency and operating discipline in our investments § Deliver a strong track record of outperformance We power our industry leading results through collaboration, innovation, and execution 115
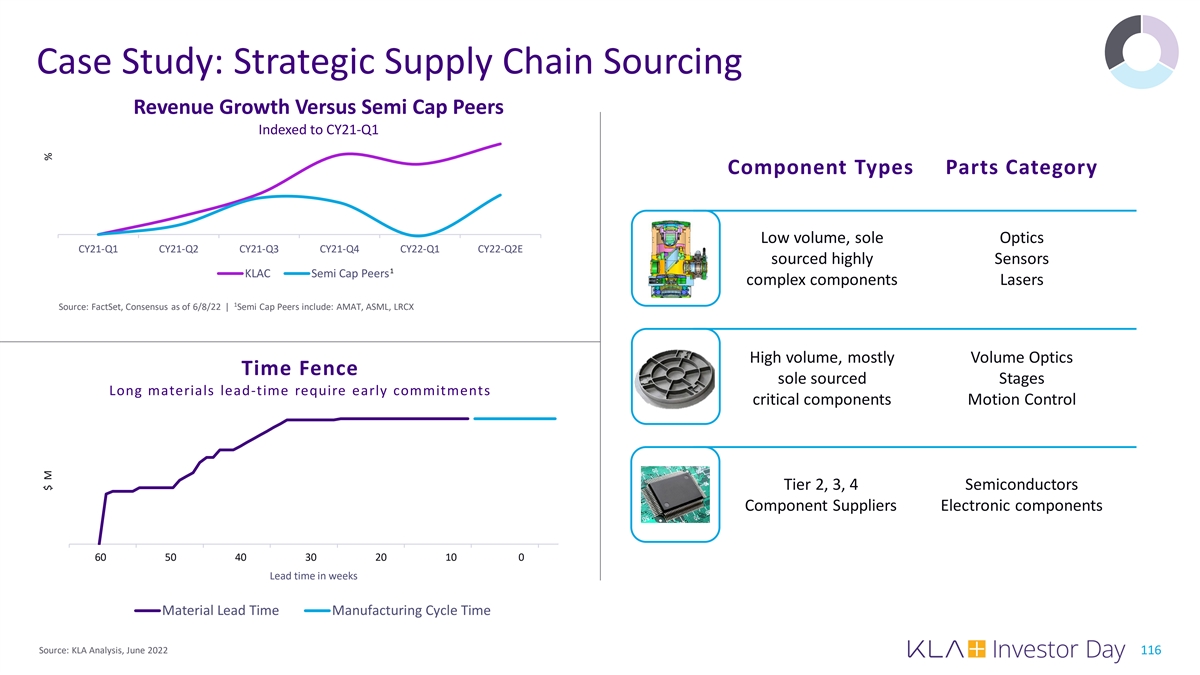
Case Study: Strategic Supply Chain Sourcing Revenue Growth Versus Semi Cap Peers Indexed to CY21-Q1 Component Types Parts Category Low volume, sole Optics CY21-Q1 CY21-Q2 CY21-Q3 CY21-Q4 CY22-Q1 CY22-Q2E sourced highly Sensors 1 KLAC Semi Cap Peers complex components Lasers 1 Source: FactSet, Consensus as of 6/8/22 | Semi Cap Peers include: AMAT, ASML, LRCX High volume, mostly Volume Optics Time Fence sole sourced Stages Long materials lead-time require early commitments critical components Motion Control Tier 2, 3, 4 Semiconductors Component Suppliers Electronic components 60 50 40 30 20 10 0 60 50 40 30 20 10 12 2 Lead time in weeks Material Lead Time Manufacturing Cycle Time Source: KLA Analysis, June 2022 116 $ M %
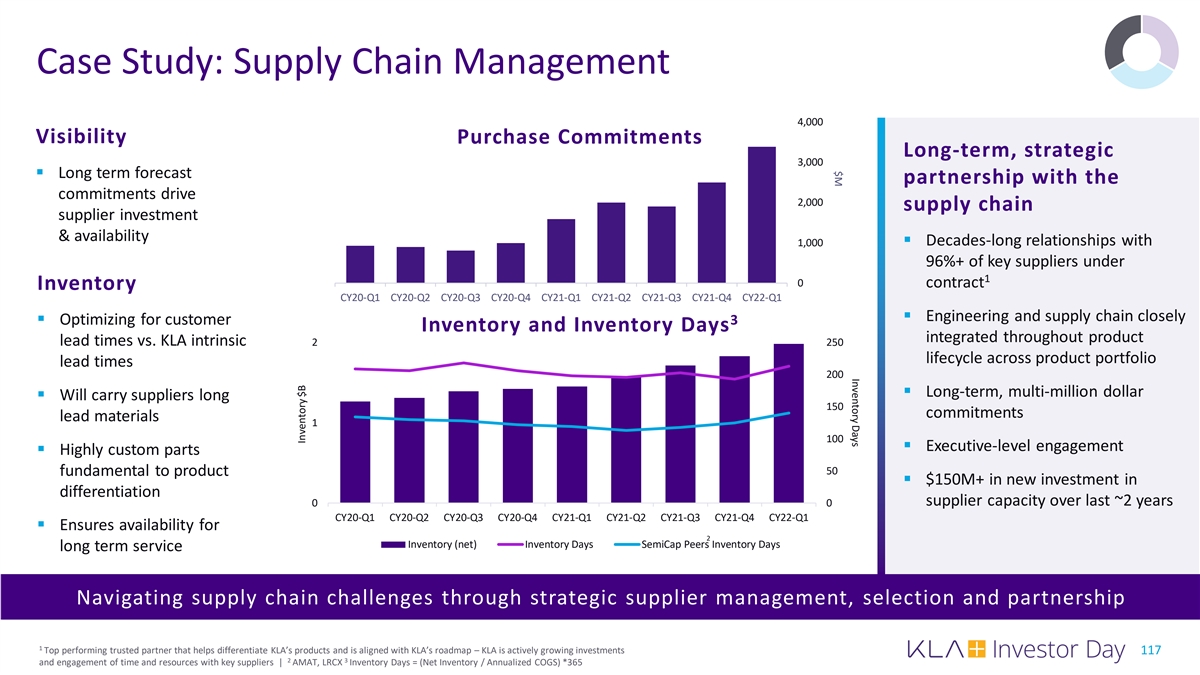
Inventory Days $M Case Study: Supply Chain Management 4,000 Visibility Purchase Commitments Long-term, strategic 3,000 § Long term forecast partnership with the commitments drive 2,000 supply chain supplier investment & availability 1,000§ Decades-long relationships with 96%+ of key suppliers under 1 0 contract Inventory CY20-Q1 CY20-Q2 CY20-Q3 CY20-Q4 CY21-Q1 CY21-Q2 CY21-Q3 CY21-Q4 CY22-Q1 § Engineering and supply chain closely § Optimizing for customer 3 Inventory and Inventory Days integrated throughout product lead times vs. KLA intrinsic 2 250 lifecycle across product portfolio lead times 200 § Long-term, multi-million dollar § Will carry suppliers long 150 commitments lead materials 1 100 § Executive-level engagement § Highly custom parts 50 fundamental to product § $150M+ in new investment in differentiation 0 0 supplier capacity over last ~2 years CY20-Q1 CY20-Q2 CY20-Q3 CY20-Q4 CY21-Q1 CY21-Q2 CY21-Q3 CY21-Q4 CY22-Q1 § Ensures availability for 2 Inventory (net) Inventory Days SemiCap Peers Inventory Days long term service Navigating supply chain challenges through strategic supplier management, selection and partnership 1 Top performing trusted partner that helps differentiate KLA’s products and is aligned with KLA’s roadmap – KLA is actively growing investments 117 2 3 and engagement of time and resources with key suppliers | AMAT, LRCX Inventory Days = (Net Inventory / Annualized COGS) *365 Inventory $B
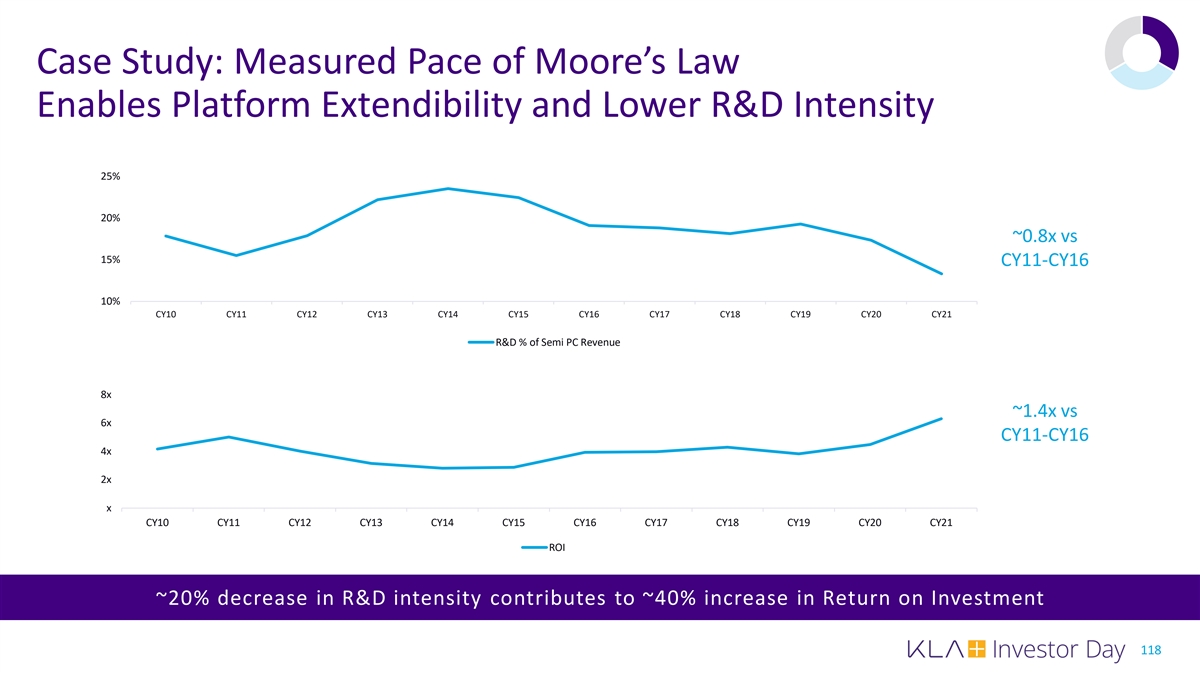
Case Study: Measured Pace of Moore’s Law Enables Platform Extendibility and Lower R&D Intensity 25% 20% ~0.8x vs 15% CY11-CY16 10% CY10 CY11 CY12 CY13 CY14 CY15 CY16 CY17 CY18 CY19 CY20 CY21 R&D % of Semi PC Revenue 8x ~1.4x vs 6x CY11-CY16 4x 2x x CY10 CY11 CY12 CY13 CY14 CY15 CY16 CY17 CY18 CY19 CY20 CY21 ROI ~20% decrease in R&D intensity contributes to ~40% increase in Return on Investment 118
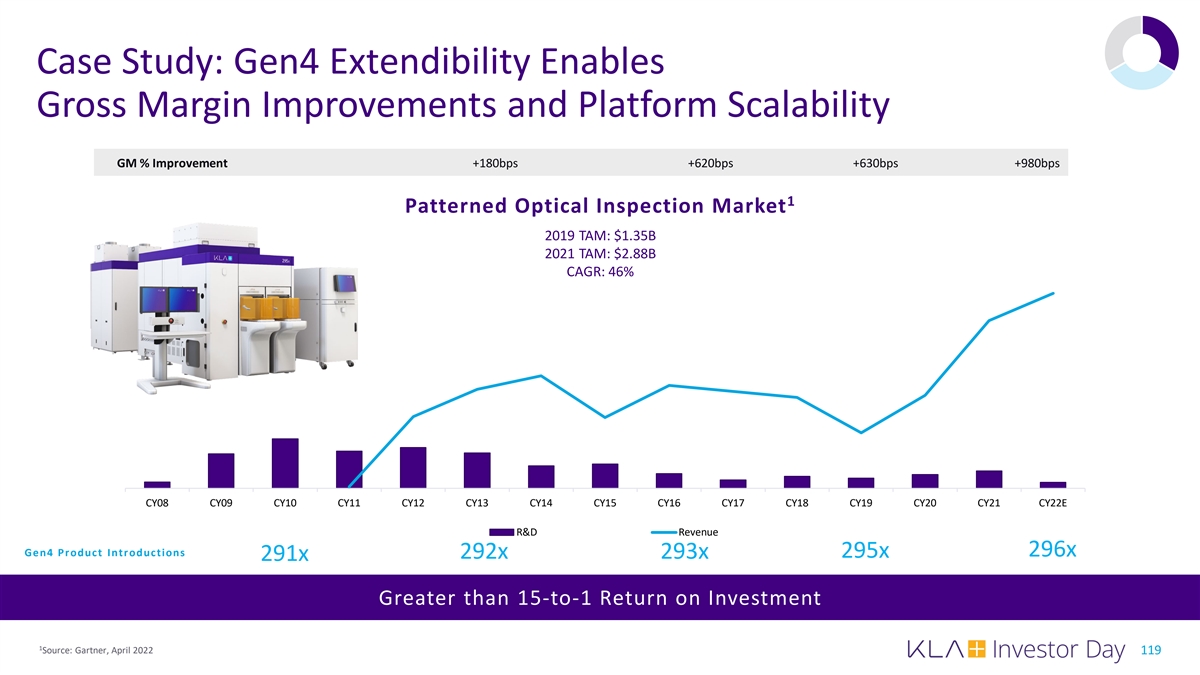
Case Study: Gen4 Extendibility Enables Gross Margin Improvements and Platform Scalability GM % Improvement +180bps +620bps +630bps +980bps 1 Patterned Optical Inspection Market 2019 TAM: $1.35B 2021 TAM: $2.88B CAGR: 46% $200 $1,200 $180 $1,000 $160 $140 $800 $120 $100 $600 $80 $400 $60 $40 $200 $20 $0 $0 CY08 CY09 CY10 CY11 CY12 CY13 CY14 CY15 CY16 CY17 CY18 CY19 CY20 CY21 CY22E R&D Revenue Gen4 Product Introductions 296x 295x 292x 293x 291x Greater than 15-to-1 Return on Investment 1 Source: Gartner, April 2022 119
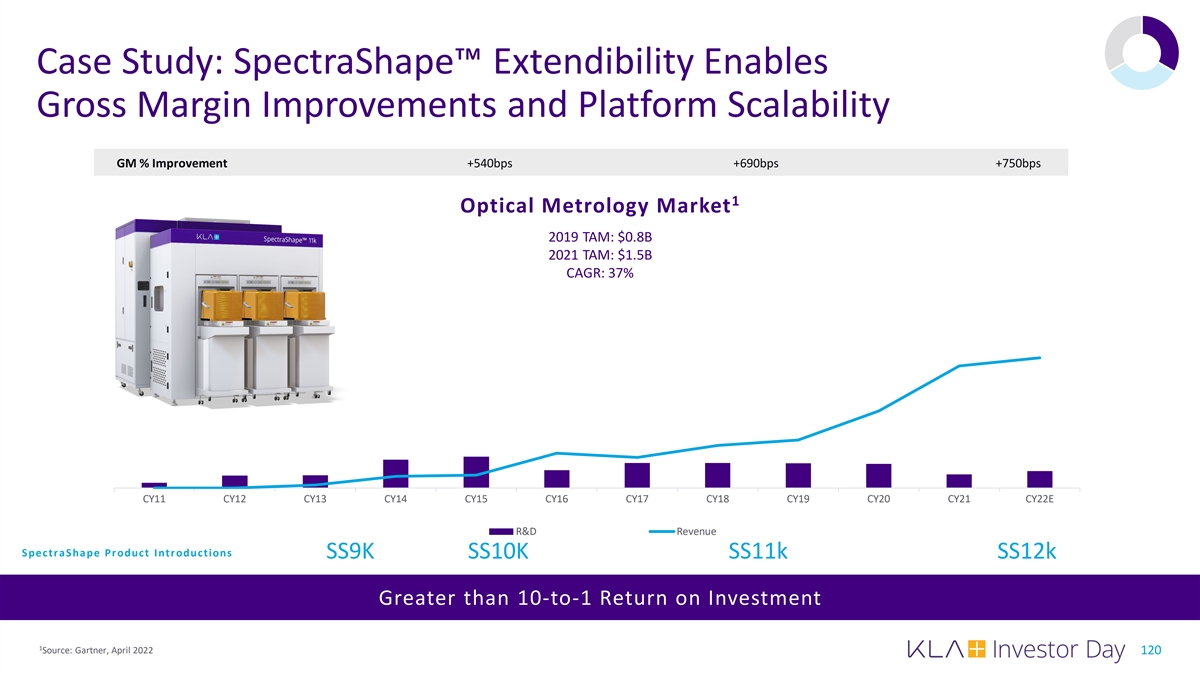
Case Study: SpectraShape™ Extendibility Enables Gross Margin Improvements and Platform Scalability GM % Improvement +540bps +690bps +750bps 1 $200 Optical Metrology Market $180 2019 TAM: $0.8B 2021 TAM: $1.5B $1,000 $160 CAGR: 37% $140 $120 $100 $500 $80 $60 $40 $20 $0 $0 CY11 CY12 CY13 CY14 CY15 CY16 CY17 CY18 CY19 CY20 CY21 CY22E R&D Revenue Spectr aShape Product Introductions SS9K SS10K SS11k SS12k Greater than 10-to-1 Return on Investment 1 Source: Gartner, April 2022 120
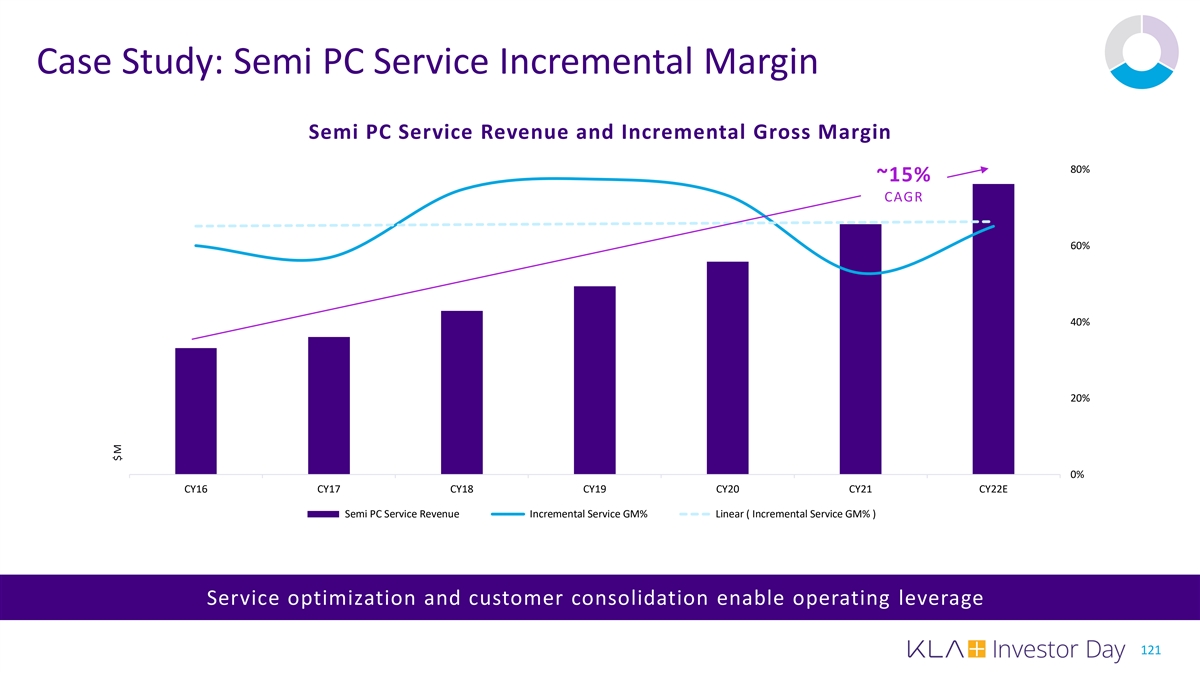
Case Study: Semi PC Service Incremental Margin Semi PC Service Revenue and Incremental Gross Margin 1,800 80% ~15% CAGR 1,600 1,400 60% 1,200 1,000 40% 800 600 20% 400 200 - 0% CY16 CY17 CY18 CY19 CY20 CY21 CY22E Semi PC Service Revenue Incremental Service GM% Linear ( Incremental Service GM% ) Service optimization and customer consolidation enable operating leverage 121 $M
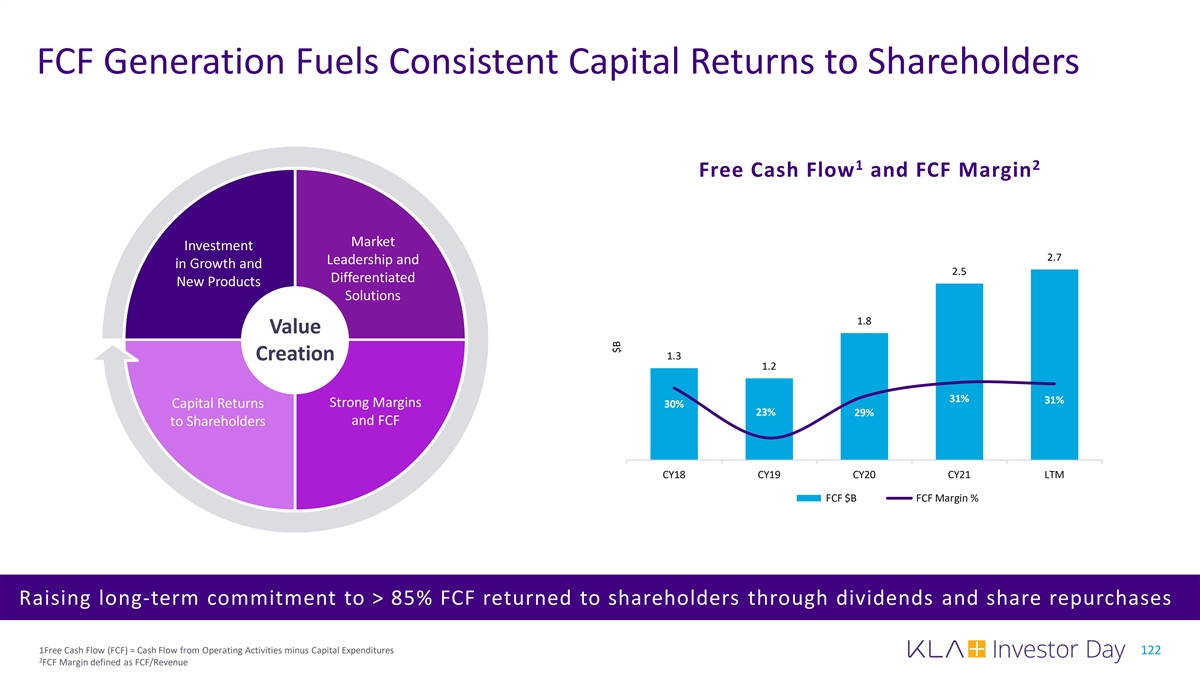
FCF Generation Fuels Consistent Capital Returns to Shareholders 1 2 Free Cash Flow and FCF Margin Investment Market Market Investment in Growth Leadership and 2.7 Leadership and in Growth and 2.5 and New Differentiated Differentiated New Products Products S So olu lu tio tin o sns 1.8 Value Creation 1.3 1.2 31% 31% Capital Returns Strong Margins 30% 23% 29% and FCF to Shareholders Cash Returns to Strong Stockholders Margins and FCF CY18 CY19 CY20 CY21 LTM FCF $B FCF Margin % Raising long-term commitment to > R 8 esi 5% lien FC t F Frree C eturne ash d F tloo s wha Gen reho erla de tin rsg tM hroodug elh dividends and share repurchases 1Free Cash Flow (FCF) = Cash Flow from Operating Activities minus Capital Expenditures 122 2 FCF Margin defined as FCF/Revenue $B
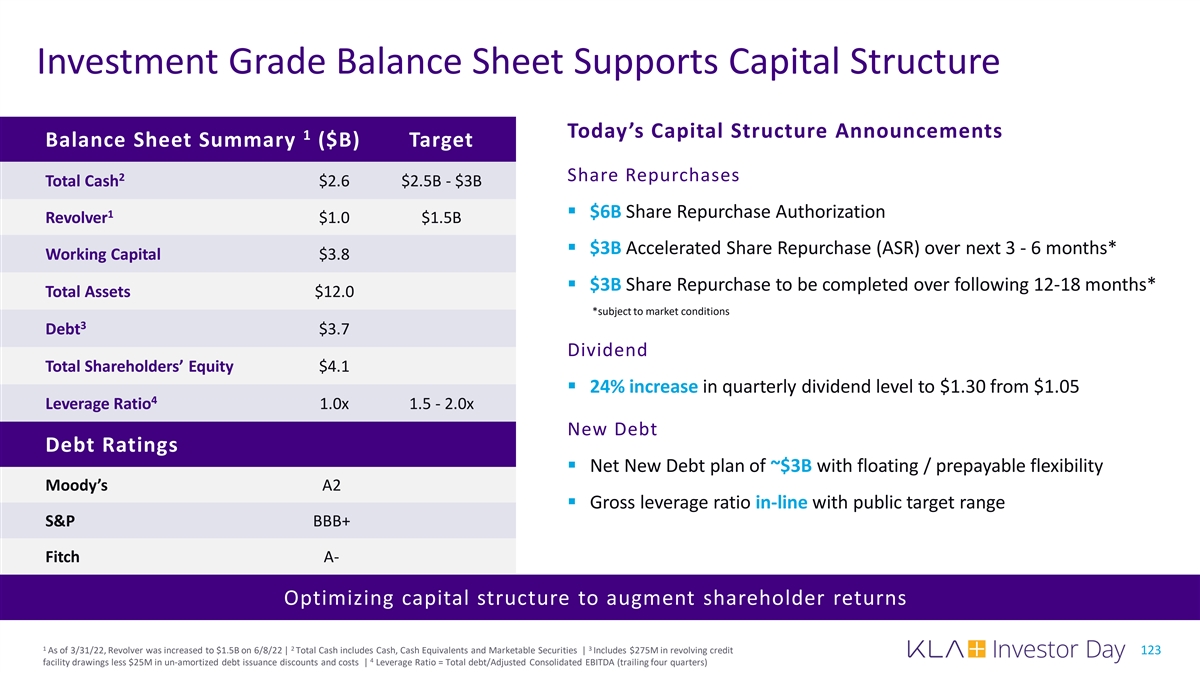
Investment Grade Balance Sheet Supports Capital Structure Today’s Capital Structure Announcements 1 Balance Sheet Summary ($B) Target 2 Share Repurchases Total Cash $2.6 $2.5B - $3B 1§ $6B Share Repurchase Authorization Revolver $1.0 $1.5B § $3B Accelerated Share Repurchase (ASR) over next 3 - 6 months* Working Capital $3.8 § $3B Share Repurchase to be completed over following 12-18 months* Total Assets $12.0 *subject to market conditions 3 Debt $3.7 Dividend Total Shareholders’ Equity $4.1 § 24% increase in quarterly dividend level to $1.30 from $1.05 4 Leverage Ratio 1.0x 1.5 - 2.0x New Debt Debt Ratings § Net New Debt plan of ~$3B with floating / prepayable flexibility Moody’s A2 § Gross leverage ratio in-line with public target range S&P BBB+ Fitch A- Optimizing capital structure to augment shareholder returns 1 2 3 As of 3/31/22, Revolver was increased to $1.5B on 6/8/22 | Total Cash includes Cash, Cash Equivalents and Marketable Securities | Includes $275M in revolving credit 123 4 facility drawings less $25M in un-amortized debt issuance discounts and costs | Leverage Ratio = Total debt/Adjusted Consolidated EBITDA (trailing four quarters)
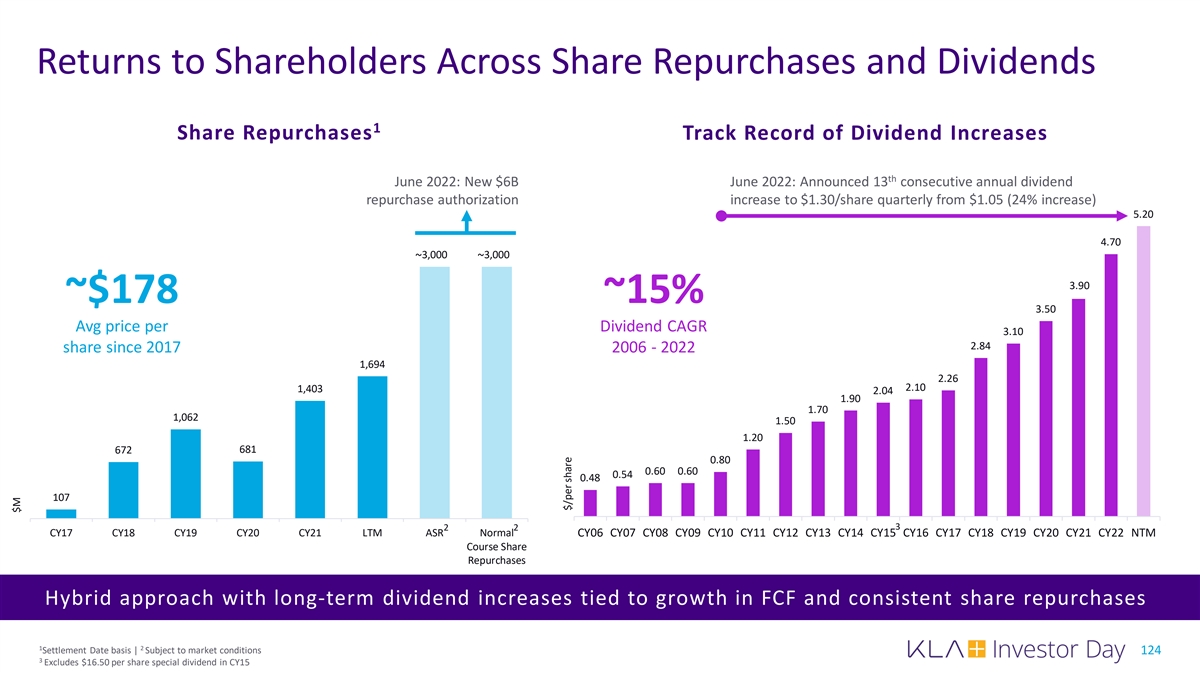
Returns to Shareholders Across Share Repurchases and Dividends 1 Share Repurchases Track Record of Dividend Increases th June 2022: New $6B June 2022: Announced 13 consecutive annual dividend repurchase authorization increase to $1.30/share quarterly from $1.05 (24% increase) 5.20 4.70 3,000 3,000 ~ ~ 3.90 ~$178 ~15% 3.50 Avg price per Dividend CAGR 3.10 2.84 share since 2017 2006 - 2022 1,694 2.26 2.10 1,403 2.04 1.90 1.70 1,062 1.50 1.20 681 672 0.80 0.60 0.60 0.54 0.48 107 3 2 2 CY17 CY18 CY19 CY20 CY21 LTM ASR Normal CY06 CY07 CY08 CY09 CY10 CY11 CY12 CY13 CY14 CY15 CY16 CY17 CY18 CY19 CY20 CY21 CY22 NTM Course Share Repurchases Hybrid approach with long-term dividend increases tied to growth in FCF and consistent share repurchases 1 2 Settlement Date basis | Subject to market conditions 124 3 Excludes $16.50 per share special dividend in CY15 $M $/per share
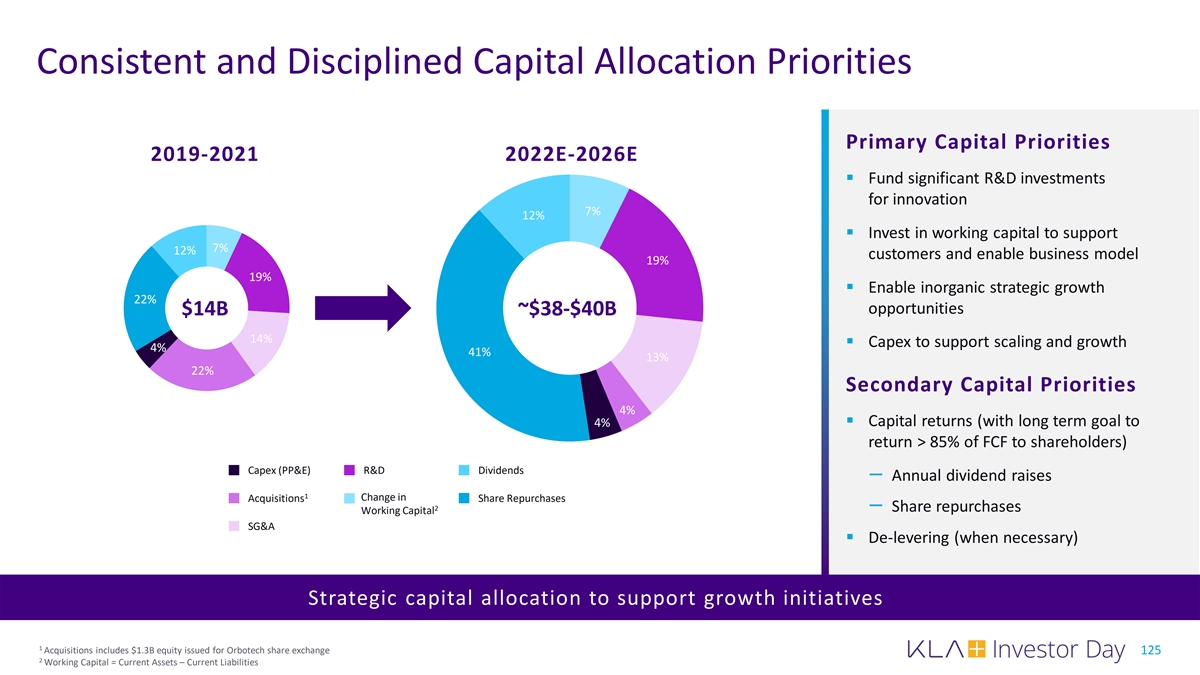
Consistent and Disciplined Capital Allocation Priorities Primary Capital Priorities 2019-2021 2022E-2026E § Fund significant R&D investments for innovation 7% 12% § Invest in working capital to support 7% 12% customers and enable business model 19% 19% § Enable inorganic strategic growth 22% opportunities $14B ~$38-$40B 14% § Capex to support scaling and growth 4% 41% 13% 22% Secondary Capital Priorities 4% § Capital returns (with long term goal to 4% return > 85% of FCF to shareholders) Capex (PP&E) R&D Dividends ꟷ Annual dividend raises 1 Change in Acquisitions Share Repurchases 2 ꟷ Share repurchases Working Capital SG&A § De-levering (when necessary) Strategic capital allocation to support growth initiatives 1 Acquisitions includes $1.3B equity issued for Orbotech share exchange 125 2 Working Capital = Current Assets – Current Liabilities
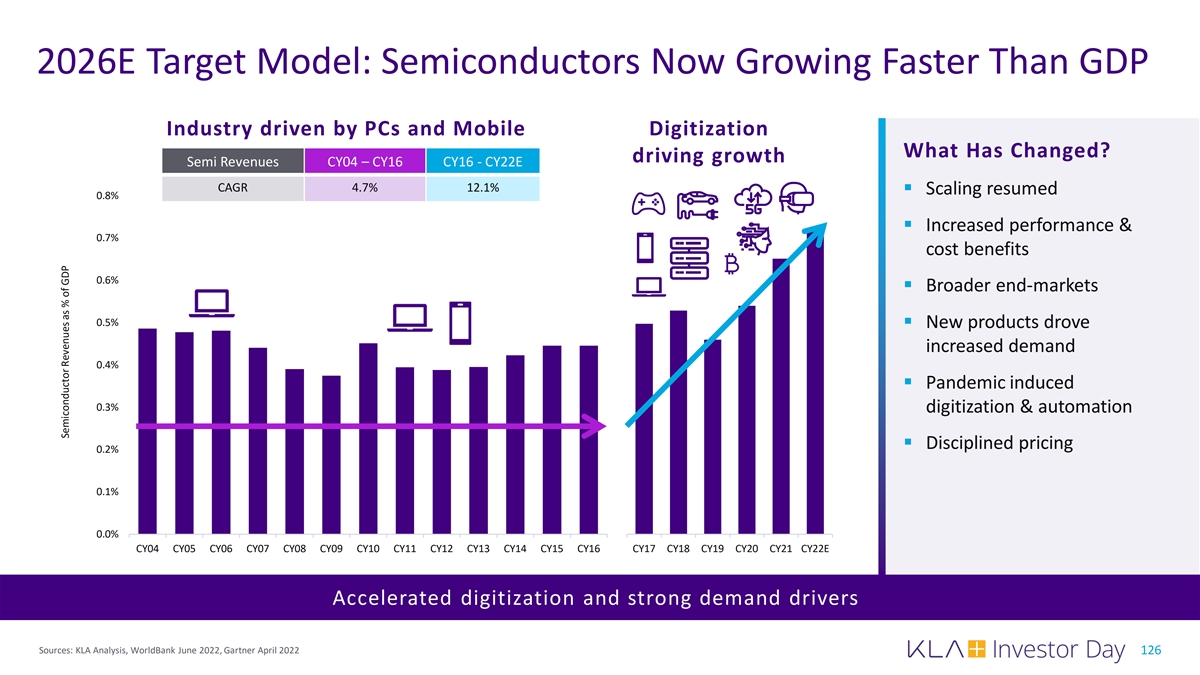
2026E Target Model: Semiconductors Now Growing Faster Than GDP Industry driven by PCs and Mobile Digitization What Has Changed? driving growth Semi Revenues CY04 – CY16 CY16 - CY22E CAGR 4.7% 12.1% § Scaling resumed 0.8% § Increased performance & 0.7% cost benefits 0.6% § Broader end-markets 0.5% § New products drove increased demand 0.4% § Pandemic induced 0.3% digitization & automation § Disciplined pricing 0.2% 0.1% 0.0% CY04 CY05 CY06 CY07 CY08 CY09 CY10 CY11 CY12 CY13 CY14 CY15 CY16 CY17 CY18 CY19 CY20 CY21 CY22E Accelerated digitization and strong demand drivers Sources: KLA Analysis, WorldBank June 2022, Gartner April 2022 126 Semiconductor Revenues as % of GDP
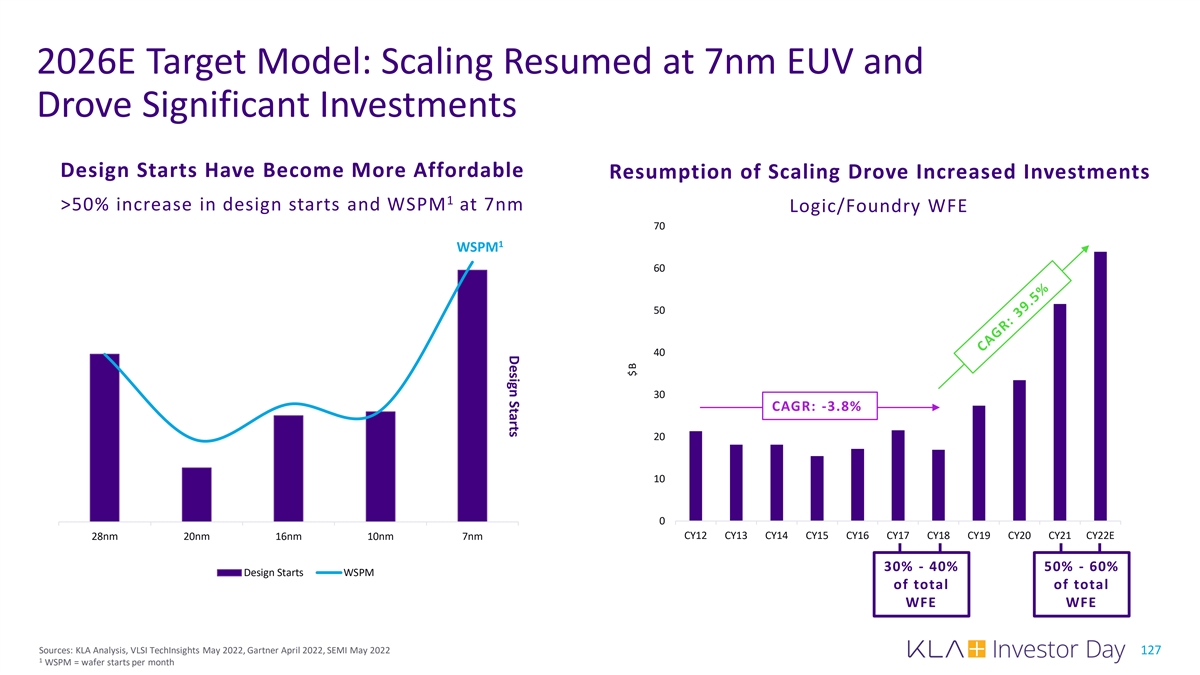
Design Starts 2026E Target Model: Scaling Resumed at 7nm EUV and Drove Significant Investments Design Starts Have Become More Affordable Resumption of Scaling Drove Increased Investments 1 >50% increase in design starts and WSPM at 7nm Logic/Foundry WFE 70 1 WSPM 60 50 40 30 CAGR: -3.8% 20 10 0 CY12 CY13 CY14 CY15 CY16 CY17 CY18 CY19 CY20 CY21 CY22E 28nm 20nm 16nm 10nm 7nm 30% - 40% 50% - 60% Design Starts WSPM of total of total WFE WFE Sources: KLA Analysis, VLSI TechInsights May 2022, Gartner April 2022, SEMI May 2022 127 1 WSPM = wafer starts per month $B
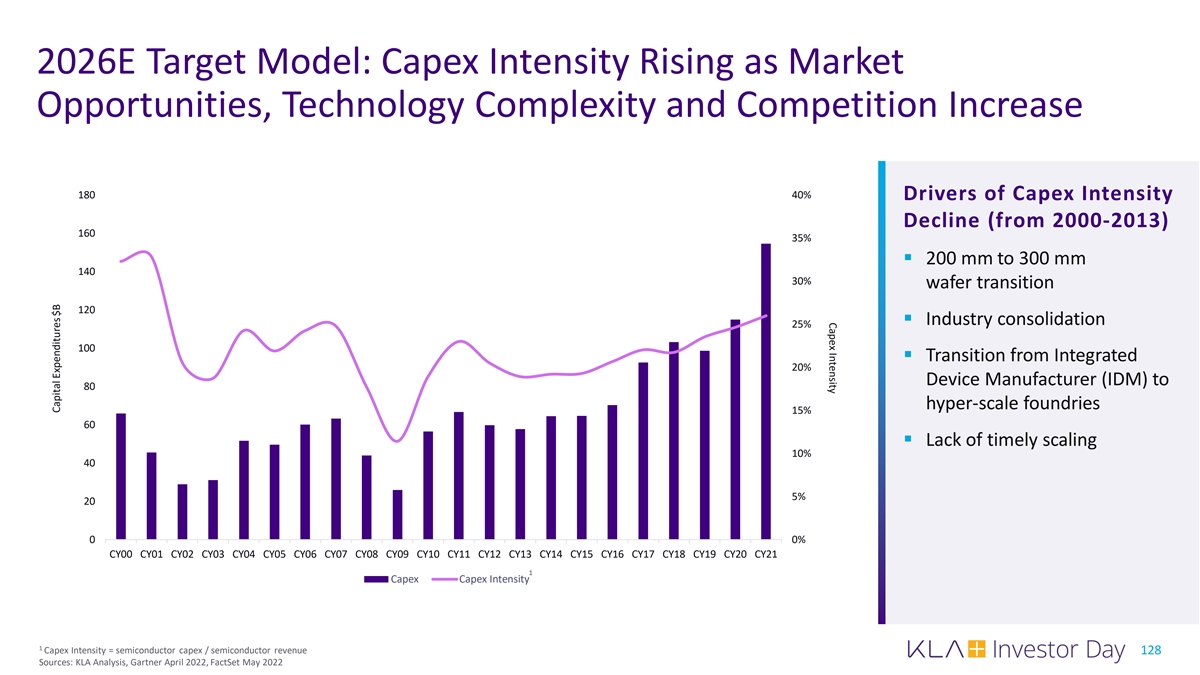
Capex Intensity 2026E Target Model: Capex Intensity Rising as Market Opportunities, Technology Complexity and Competition Increase 180 40% Drivers of Capex Intensity Decline (from 2000-2013) 160 35% § 200 mm to 300 mm 140 30% wafer transition 120 § Industry consolidation 25% 100 § Transition from Integrated 20% Device Manufacturer (IDM) to 80 hyper-scale foundries 15% 60 § Lack of timely scaling 10% 40 5% 20 0 0% CY00 CY01 CY02 CY03 CY04 CY05 CY06 CY07 CY08 CY09 CY10 CY11 CY12 CY13 CY14 CY15 CY16 CY17 CY18 CY19 CY20 CY21 1 Capex Capex Intensity 1 Capex Intensity = semiconductor capex / semiconductor revenue 128 Sources: KLA Analysis, Gartner April 2022, FactSet May 2022 Capital Expenditures $B
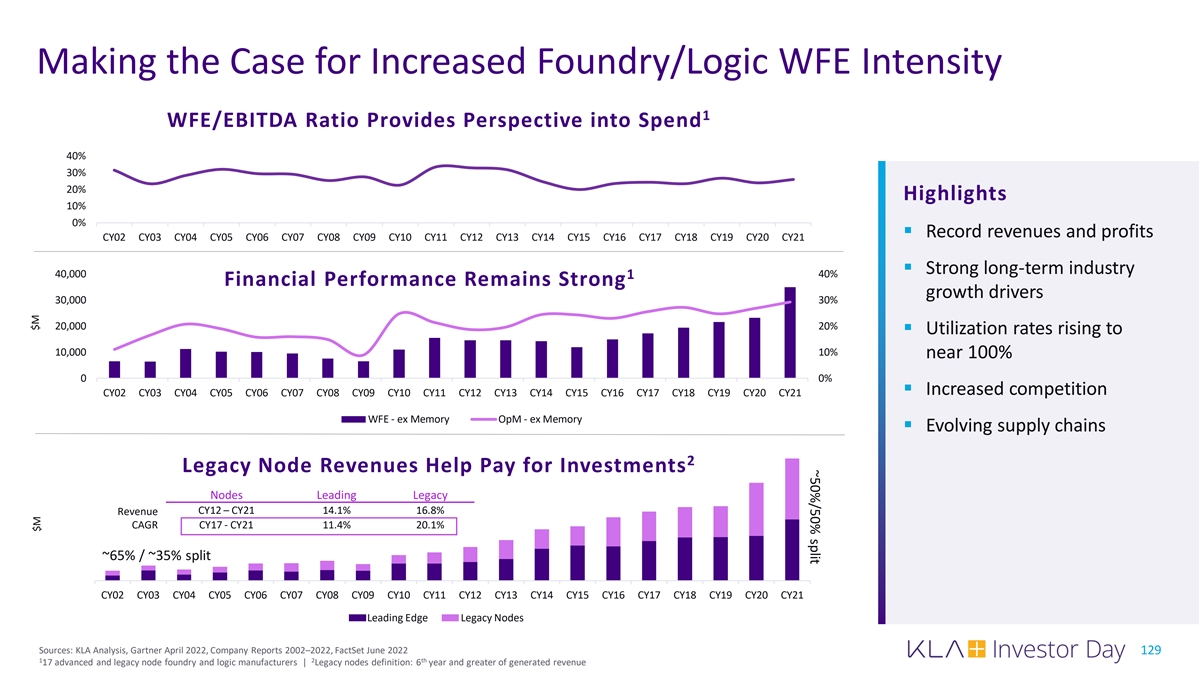
~50%/50% split Making the Case for Increased Foundry/Logic WFE Intensity 1 WFE/EBITDA Ratio Provides Perspective into Spend 40% 30% 20% Highlights 10% 0% § Record revenues and profits CY02 CY03 CY04 CY05 CY06 CY07 CY08 CY09 CY10 CY11 CY12 CY13 CY14 CY15 CY16 CY17 CY18 CY19 CY20 CY21 § Strong long-term industry 40,000 40% 1 Financial Performance Remains Strong growth drivers 30,000 30% 20,000 20% § Utilization rates rising to 10,000 10% near 100% 0 0% § Increased competition CY02 CY03 CY04 CY05 CY06 CY07 CY08 CY09 CY10 CY11 CY12 CY13 CY14 CY15 CY16 CY17 CY18 CY19 CY20 CY21 WFE - ex Memory OpM - ex Memory § Evolving supply chains 2 Legacy Node Revenues Help Pay for Investments Nodes Leading Legacy CY12 – CY21 14.1% 16.8% Revenue CAGR CY17 - CY21 11.4% 20.1% ~65% / ~35% split CY02 CY03 CY04 CY05 CY06 CY07 CY08 CY09 CY10 CY11 CY12 CY13 CY14 CY15 CY16 CY17 CY18 CY19 CY20 CY21 Leading Edge Legacy Nodes Sources: KLA Analysis, Gartner April 2022, Company Reports 2002–2022, FactSet June 2022 129 1 2 th 17 advanced and legacy node foundry and logic manufacturers | Legacy nodes definition: 6 year and greater of generated revenue $M $M
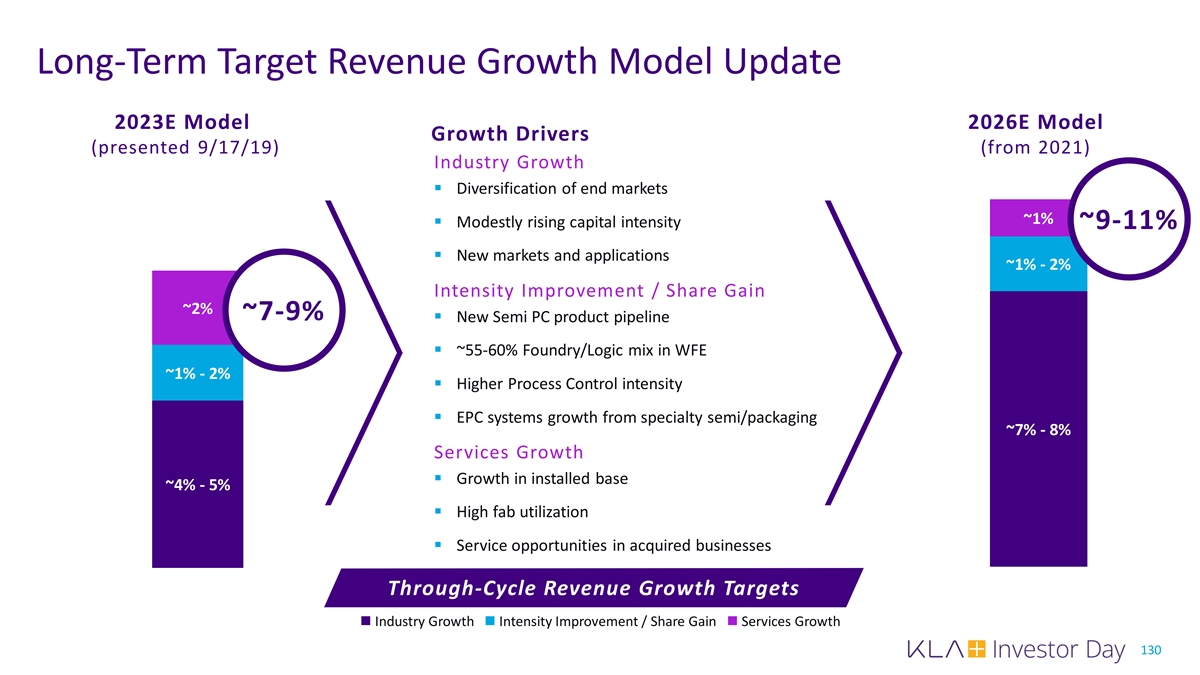
Long-Term Target Revenue Growth Model Update 2023E Model 2026E Model Growth Drivers (presented 9/17/19) (from 2021) Industry Growth § Diversification of end markets 10% 10% ~1% § Modestly rising capital intensity ~9-11% § New markets and applications ~1% - 2% Intensity Improvement / Share Gain ~2% ~7-9% § New Semi PC product pipeline § ~55-60% Foundry/Logic mix in WFE ~1% - 2% 5% § Higher Process Control intensity 5% § EPC systems growth from specialty semi/packaging ~7% - 8% Services Growth § Growth in installed base ~4% - 5% § High fab utilization § Service opportunities in acquired businesses 0% 0% Through-Cycle Revenue Growth Targets n Industry Growth n Intensity Improvement / Share Gain n Services Growth 130
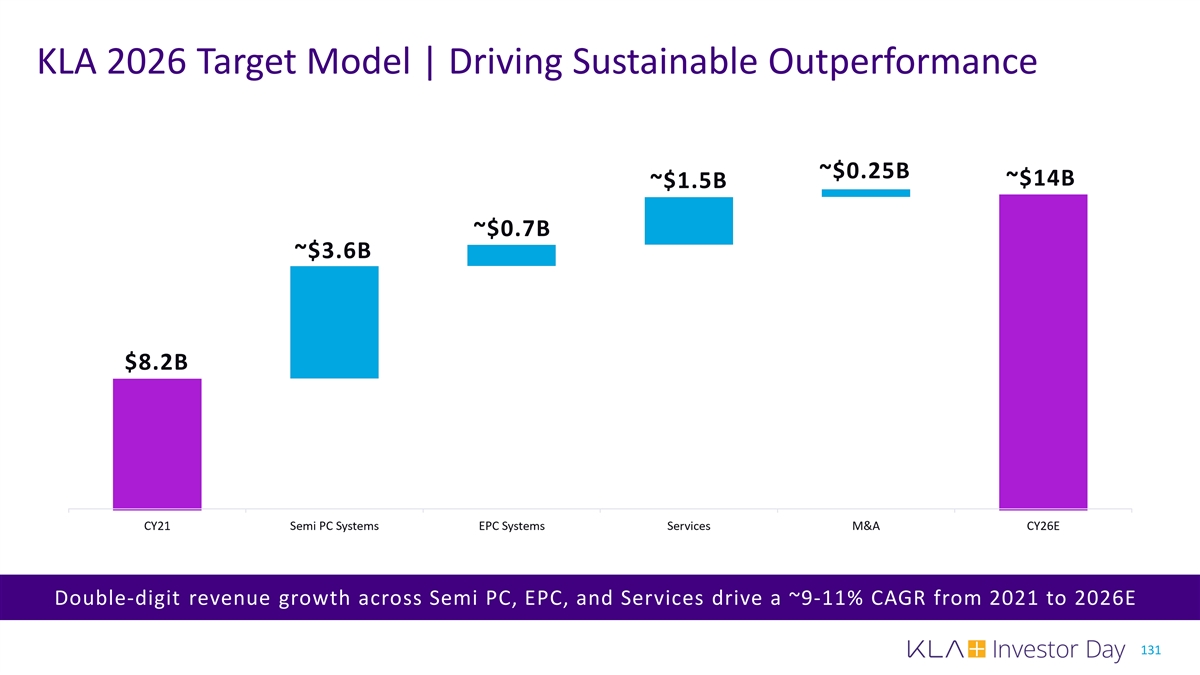
KLA 2026 Target Model | Driving Sustainable Outperformance ~$0.25B ~$14B ~$1.5B ~$0.7B ~$3.6B $8.2B Double-digit revenue growth across Semi PC, EPC, and Services drive a ~9-11% CAGR from 2021 to 2026E 131
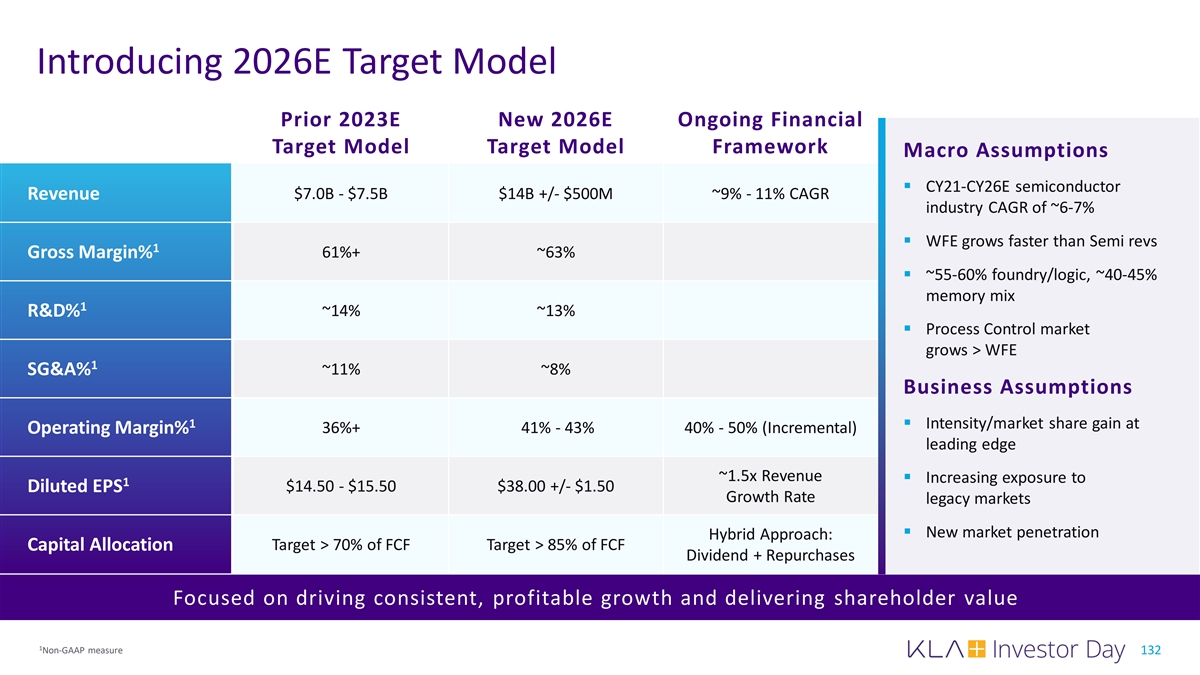
Introducing 2026E Target Model Prior 2023E New 2026E Ongoing Financial Target Model Target Model Framework Macro Assumptions § CY21-CY26E semiconductor $7.0B - $7.5B $14B +/- $500M ~9% - 11% CAGR Revenue industry CAGR of ~6-7% § WFE grows faster than Semi revs 1 61%+ ~63% Gross Margin% § ~55-60% foundry/logic, ~40-45% memory mix 1 ~14% ~13% R&D% § Process Control market grows > WFE 1 SG&A% ~11% ~8% Business Assumptions 1 § Intensity/market share gain at Operating Margin% 36%+ 41% - 43% 40% - 50% (Incremental) leading edge ~1.5x Revenue § Increasing exposure to 1 $14.50 - $15.50 $38.00 +/- $1.50 Diluted EPS Growth Rate legacy markets § New market penetration Hybrid Approach: Target > 70% of FCF Target > 85% of FCF Capital Allocation Dividend + Repurchases Focused on driving consistent, profitable growth and delivering shareholder value 1 Non-GAAP measure 132
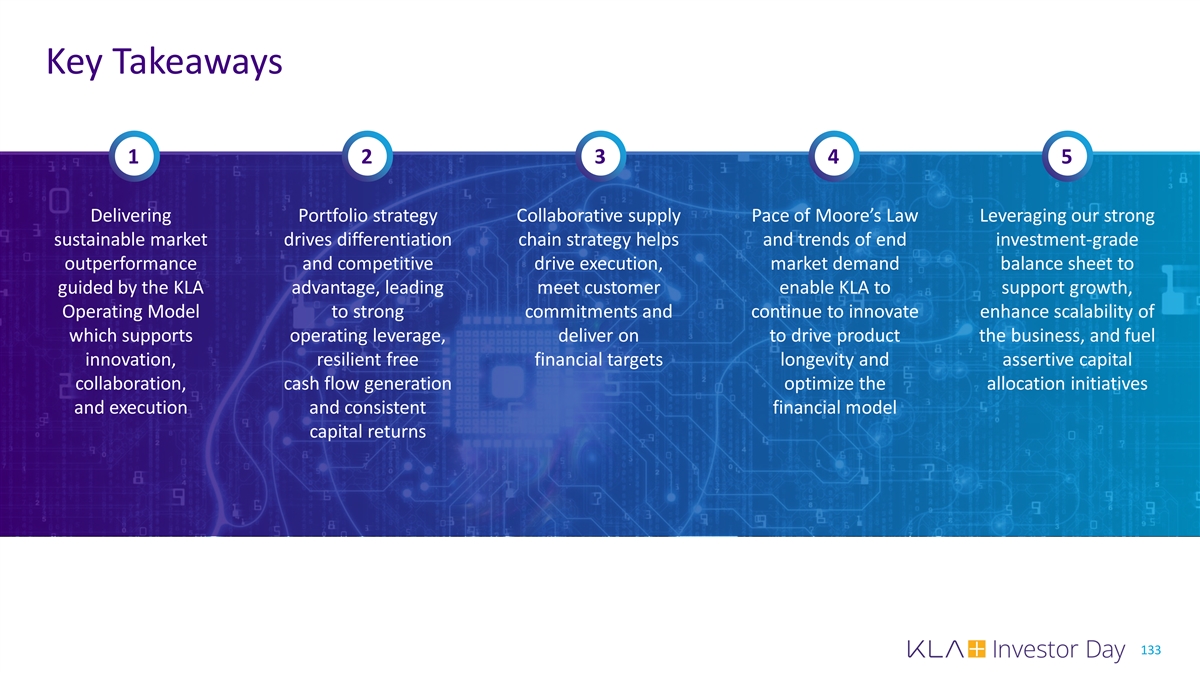
Key Takeaways 1 2 3 4 5 Delivering Portfolio strategy Collaborative supply Pace of Moore’s Law Leveraging our strong sustainable market drives differentiation chain strategy helps and trends of end investment-grade outperformance and competitive drive execution, market demand balance sheet to guided by the KLA advantage, leading meet customer enable KLA to support growth, Operating Model to strong commitments and continue to innovate enhance scalability of which supports operating leverage, deliver on to drive product the business, and fuel innovation, resilient free financial targets longevity and assertive capital collaboration, cash flow generation optimize the allocation initiatives and execution and consistent financial model capital returns 133
Rick Wallace President and CEO
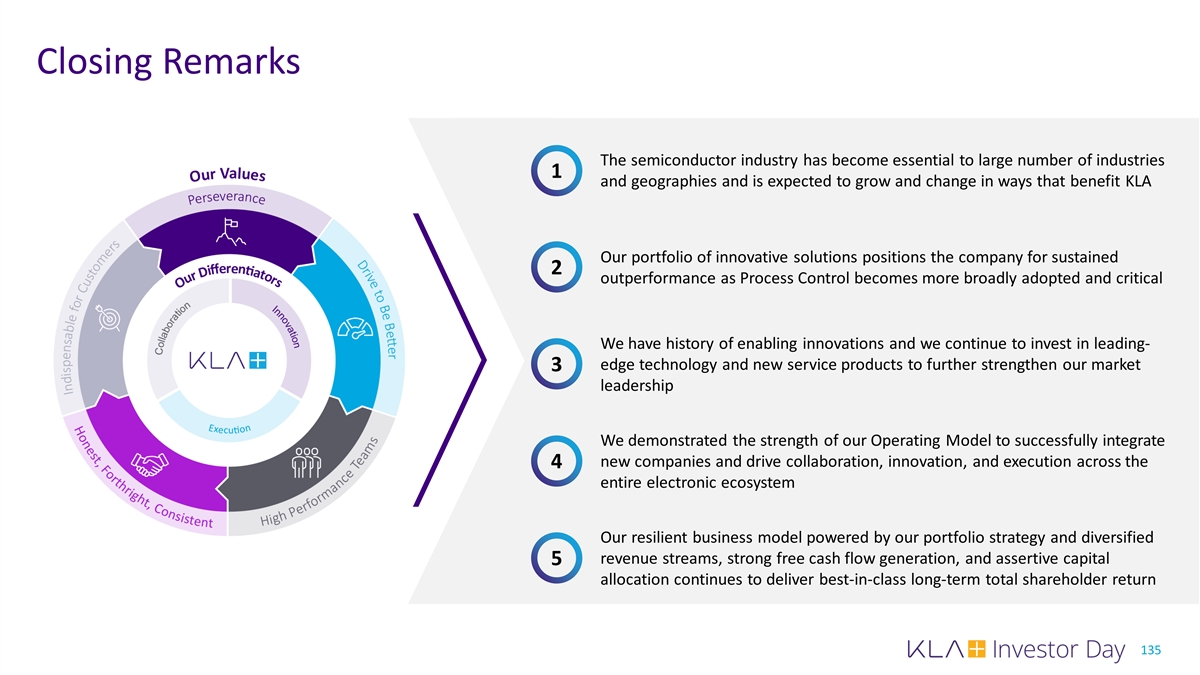
Closing Remarks The semiconductor industry has become essential to large number of industries 1 and geographies and is expected to grow and change in ways that benefit KLA Our portfolio of innovative solutions positions the company for sustained 2 outperformance as Process Control becomes more broadly adopted and critical We have history of enabling innovations and we continue to invest in leading- edge technology and new service products to further strengthen our market 3 leadership We demonstrated the strength of our Operating Model to successfully integrate new companies and drive collaboration, innovation, and execution across the 4 entire electronic ecosystem Our resilient business model powered by our portfolio strategy and diversified revenue streams, strong free cash flow generation, and assertive capital 5 allocation continues to deliver best-in-class long-term total shareholder return 135
136
Appendix Reconciliation of Non-GAAP Financial Measures
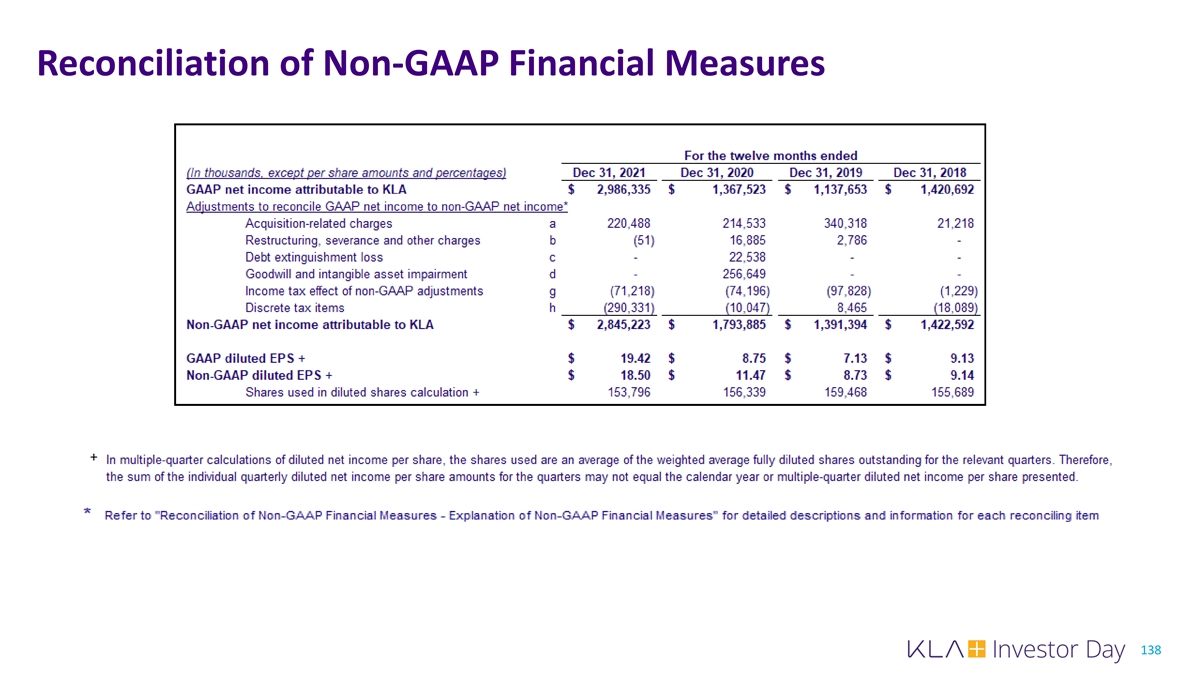
Reconciliation of Non-GAAP Financial Measures 138
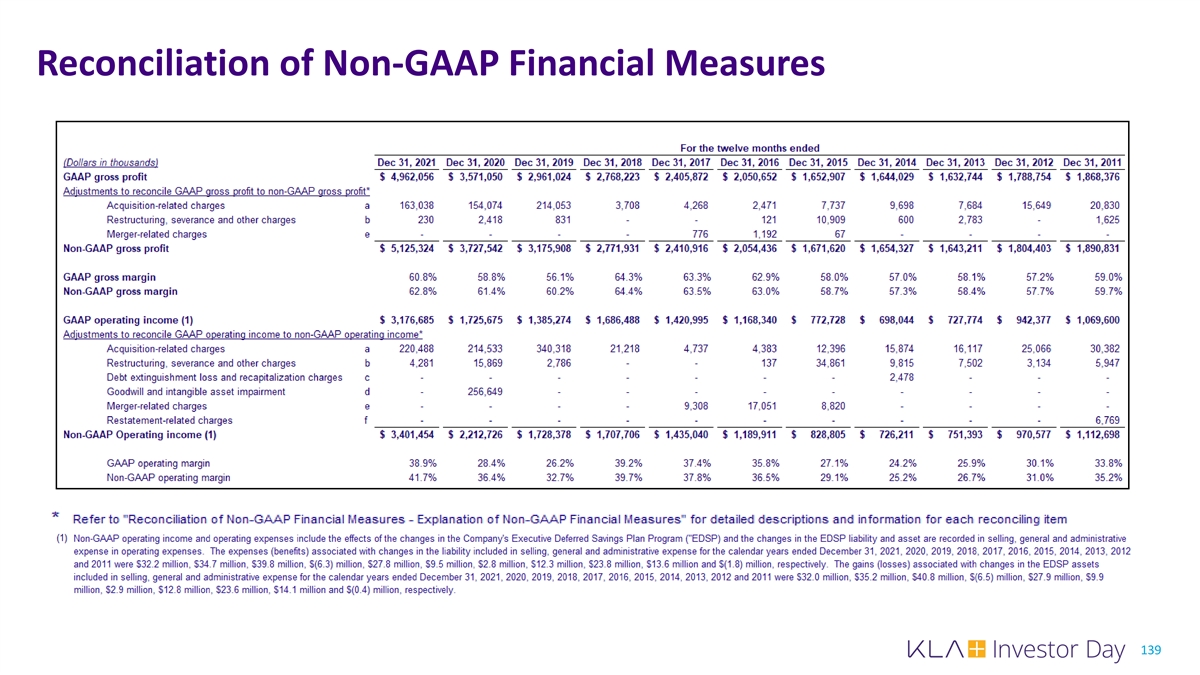
Reconciliation of Non-GAAP Financial Measures 139
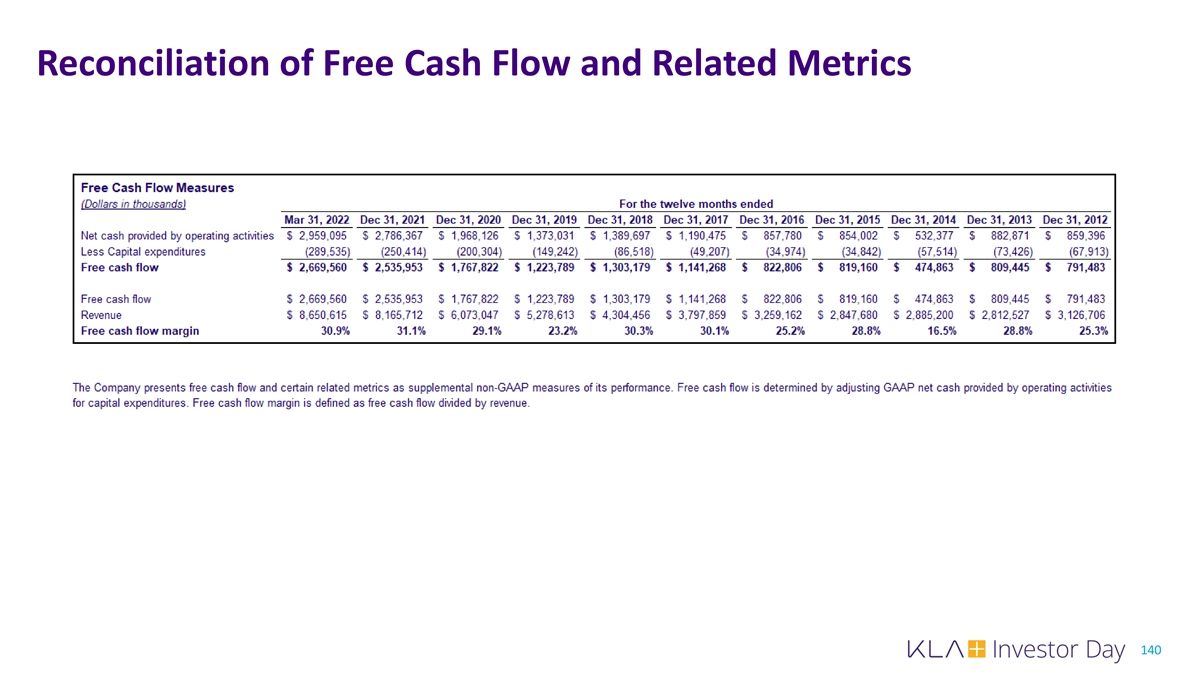
Reconciliation of Free Cash Flow and Related Metrics 140
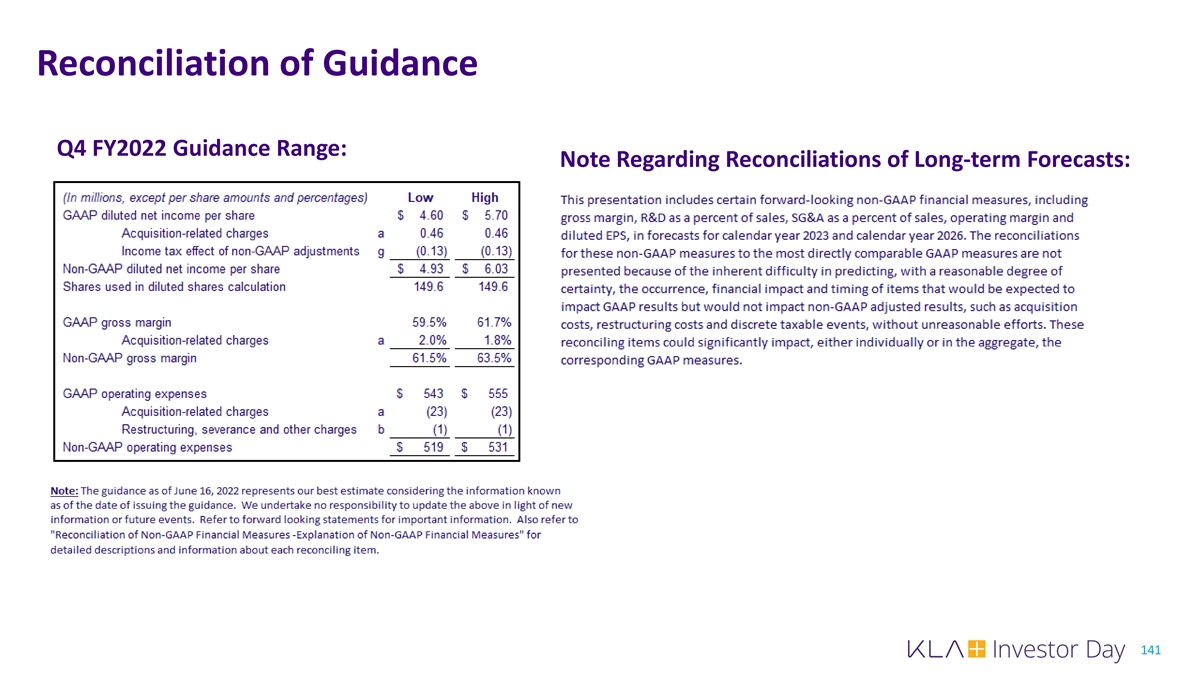
Reconciliation of Guidance Q4 FY2022 Guidance Range: Note Regarding Reconciliations of Long-term Forecasts: 141
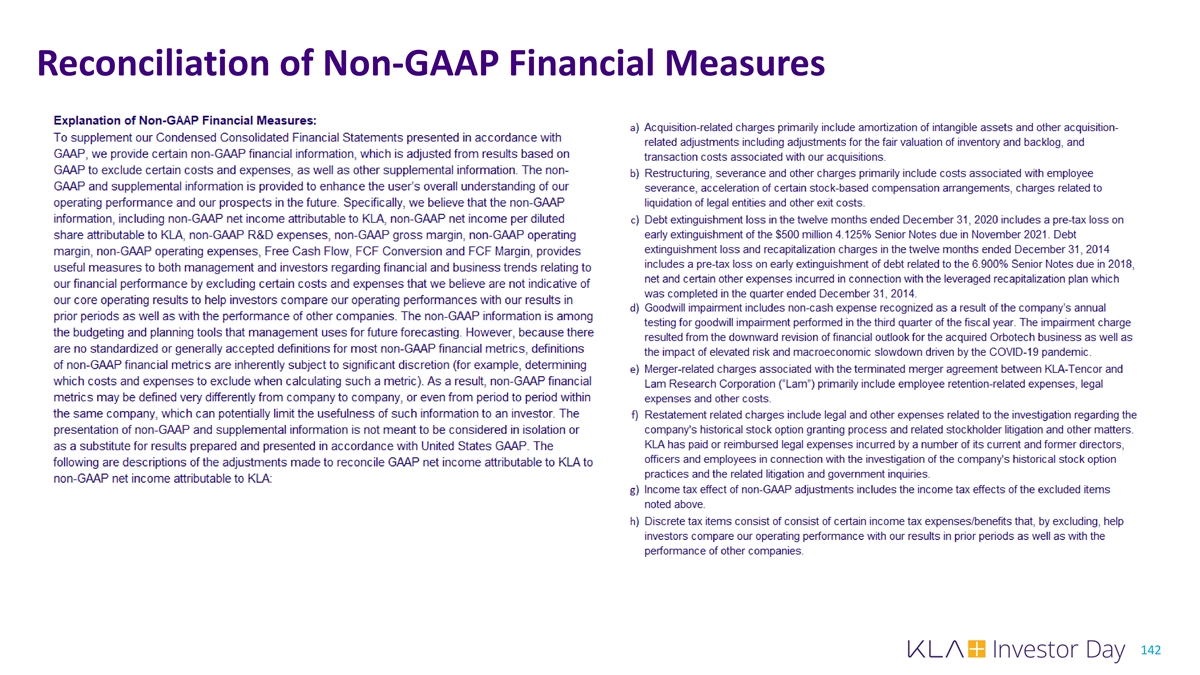
Reconciliation of Non-GAAP Financial Measures 142